Coogle Maps: An Interactive Pigeon Data Portrait of New York City
- 2026-10-22
- p5.js, Data Visualization, Mapbox, WebGL, Open Data
Coogle Maps: An Interactive Pigeon Data Portrait of New York City
本文介紹 Coogle Maps,一個探索紐約市鴿子活動的互動式資料肖像。此專案將與鴿子相關的 311 投訴,連結到附近的餐廳、公園、建築、街道設施與其他公共資料。Mapbox vector tiles 透過 WebGL 被轉換為點雲地景,動畫鴿子模型則標示重要區域。可重複使用的 Codex skill 依據在地資料產生簡短的鴿子評論,同時避免加入資料中沒有的細節。本專案展示開放城市資料、互動地圖與生成文字如何共同建立一個從鴿子視角觀看城市的趣味方式。
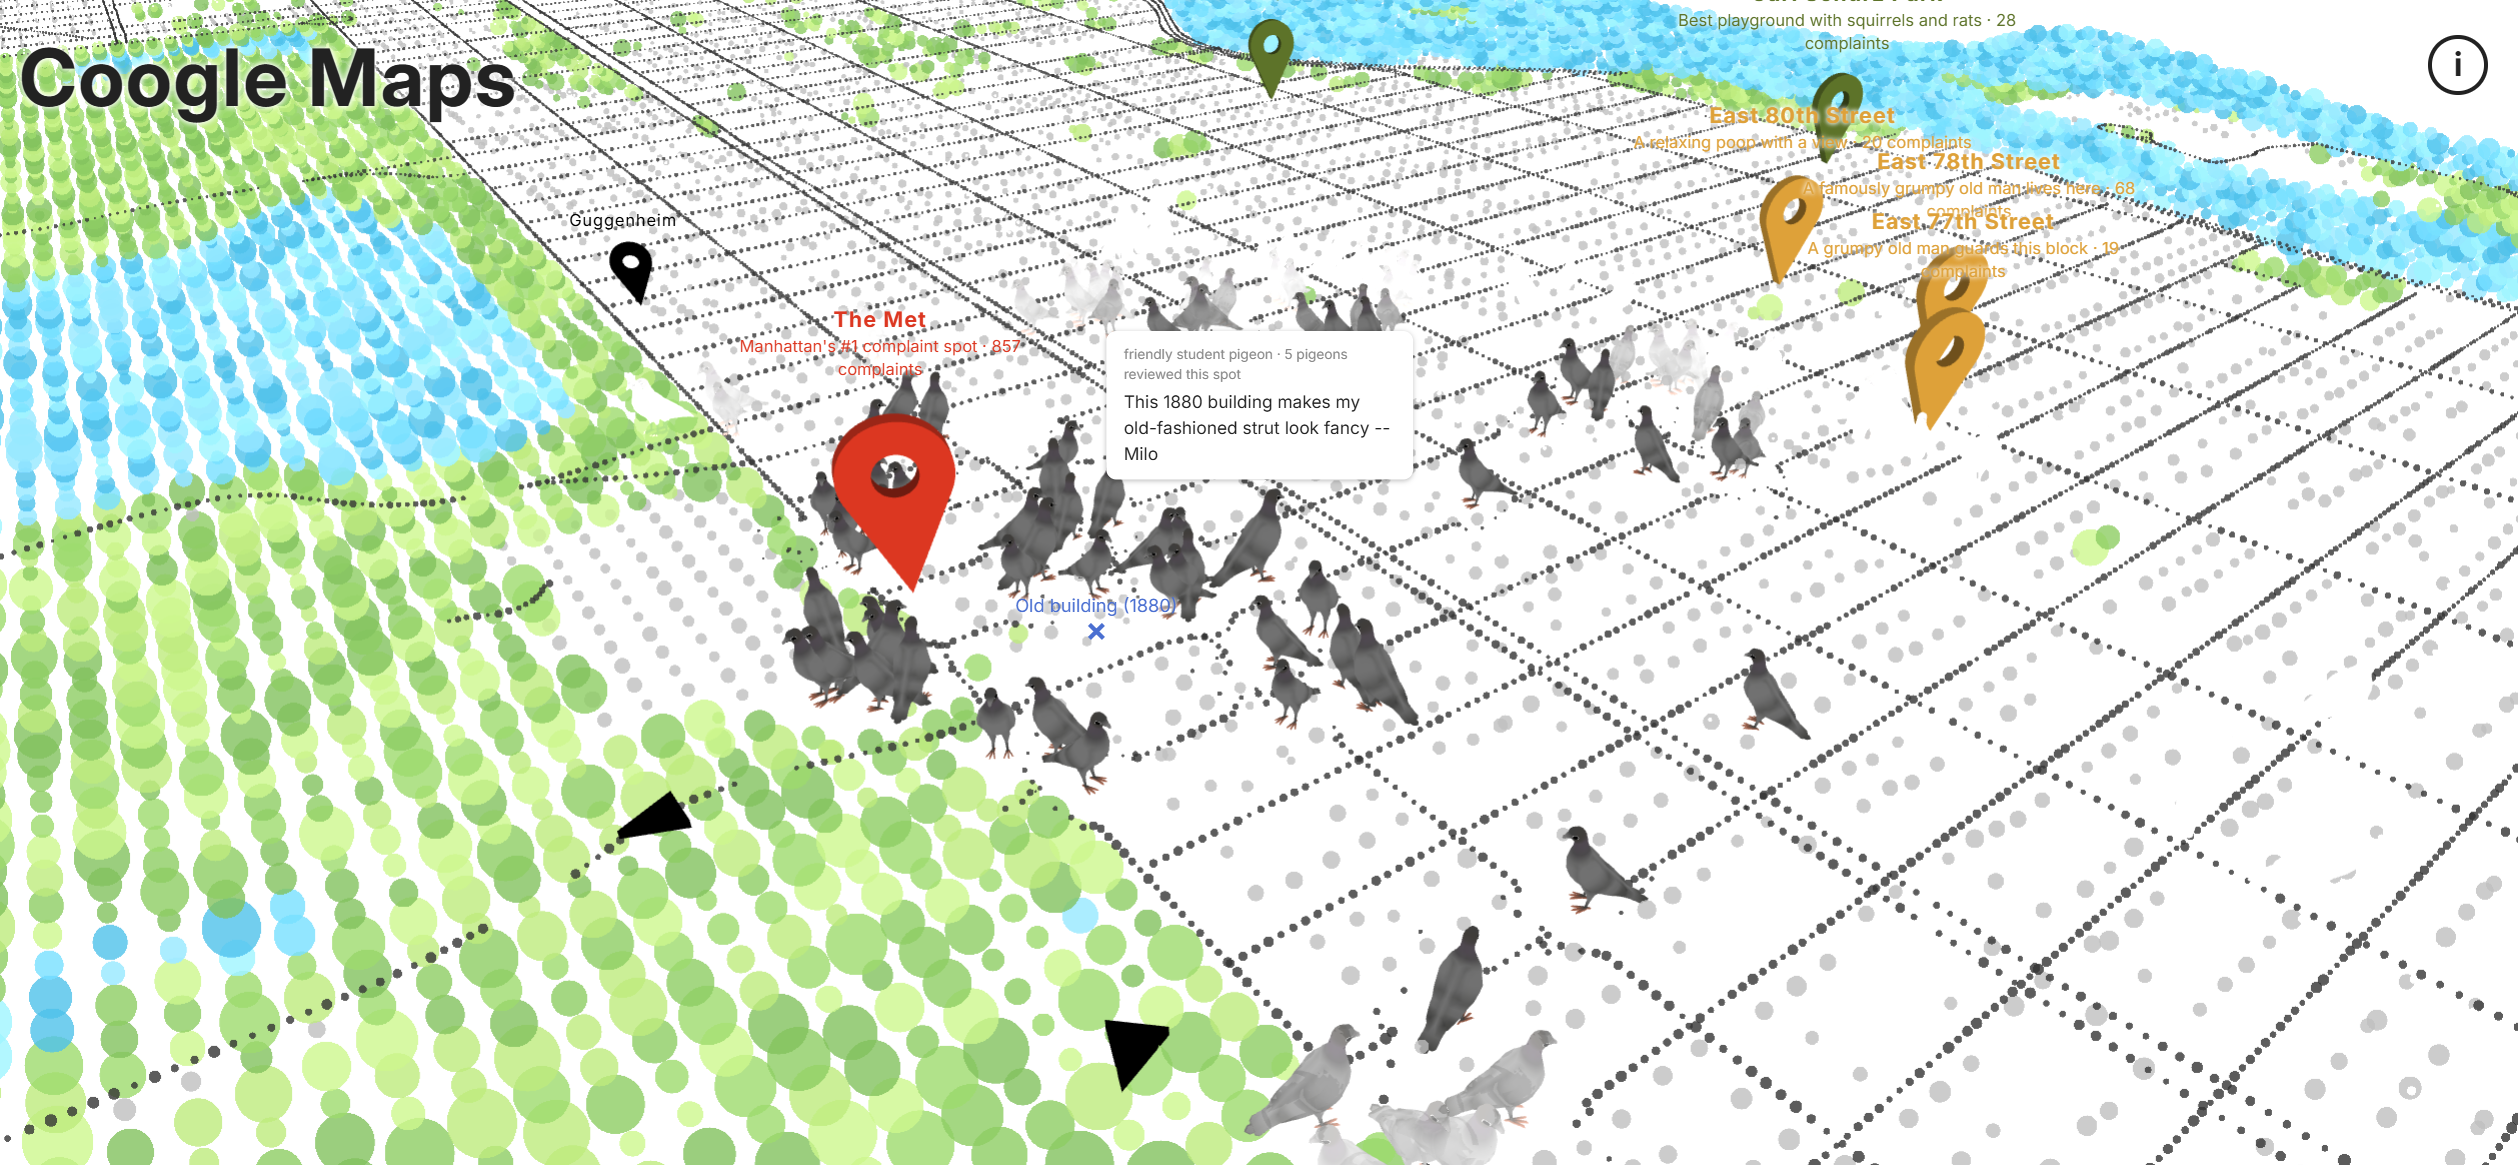
This article presents Coogle Maps, an interactive data portrait that explores pigeon activity in New York City. The project connects pigeon-related 311 complaints with nearby restaurants, parks, buildings, street furniture, and other public data. Mapbox vector tiles are rendered as a point-cloud landscape in WebGL, while animated pigeon models mark areas of interest. A reusable Codex skill uses the local records to create short pigeon reviews without adding unsupported details. The project shows how open urban data, interactive mapping, and generated text can support a playful view of the city from a pigeon’s perspective.
Result
Open Coogle Maps View the source code on GitHubIdea
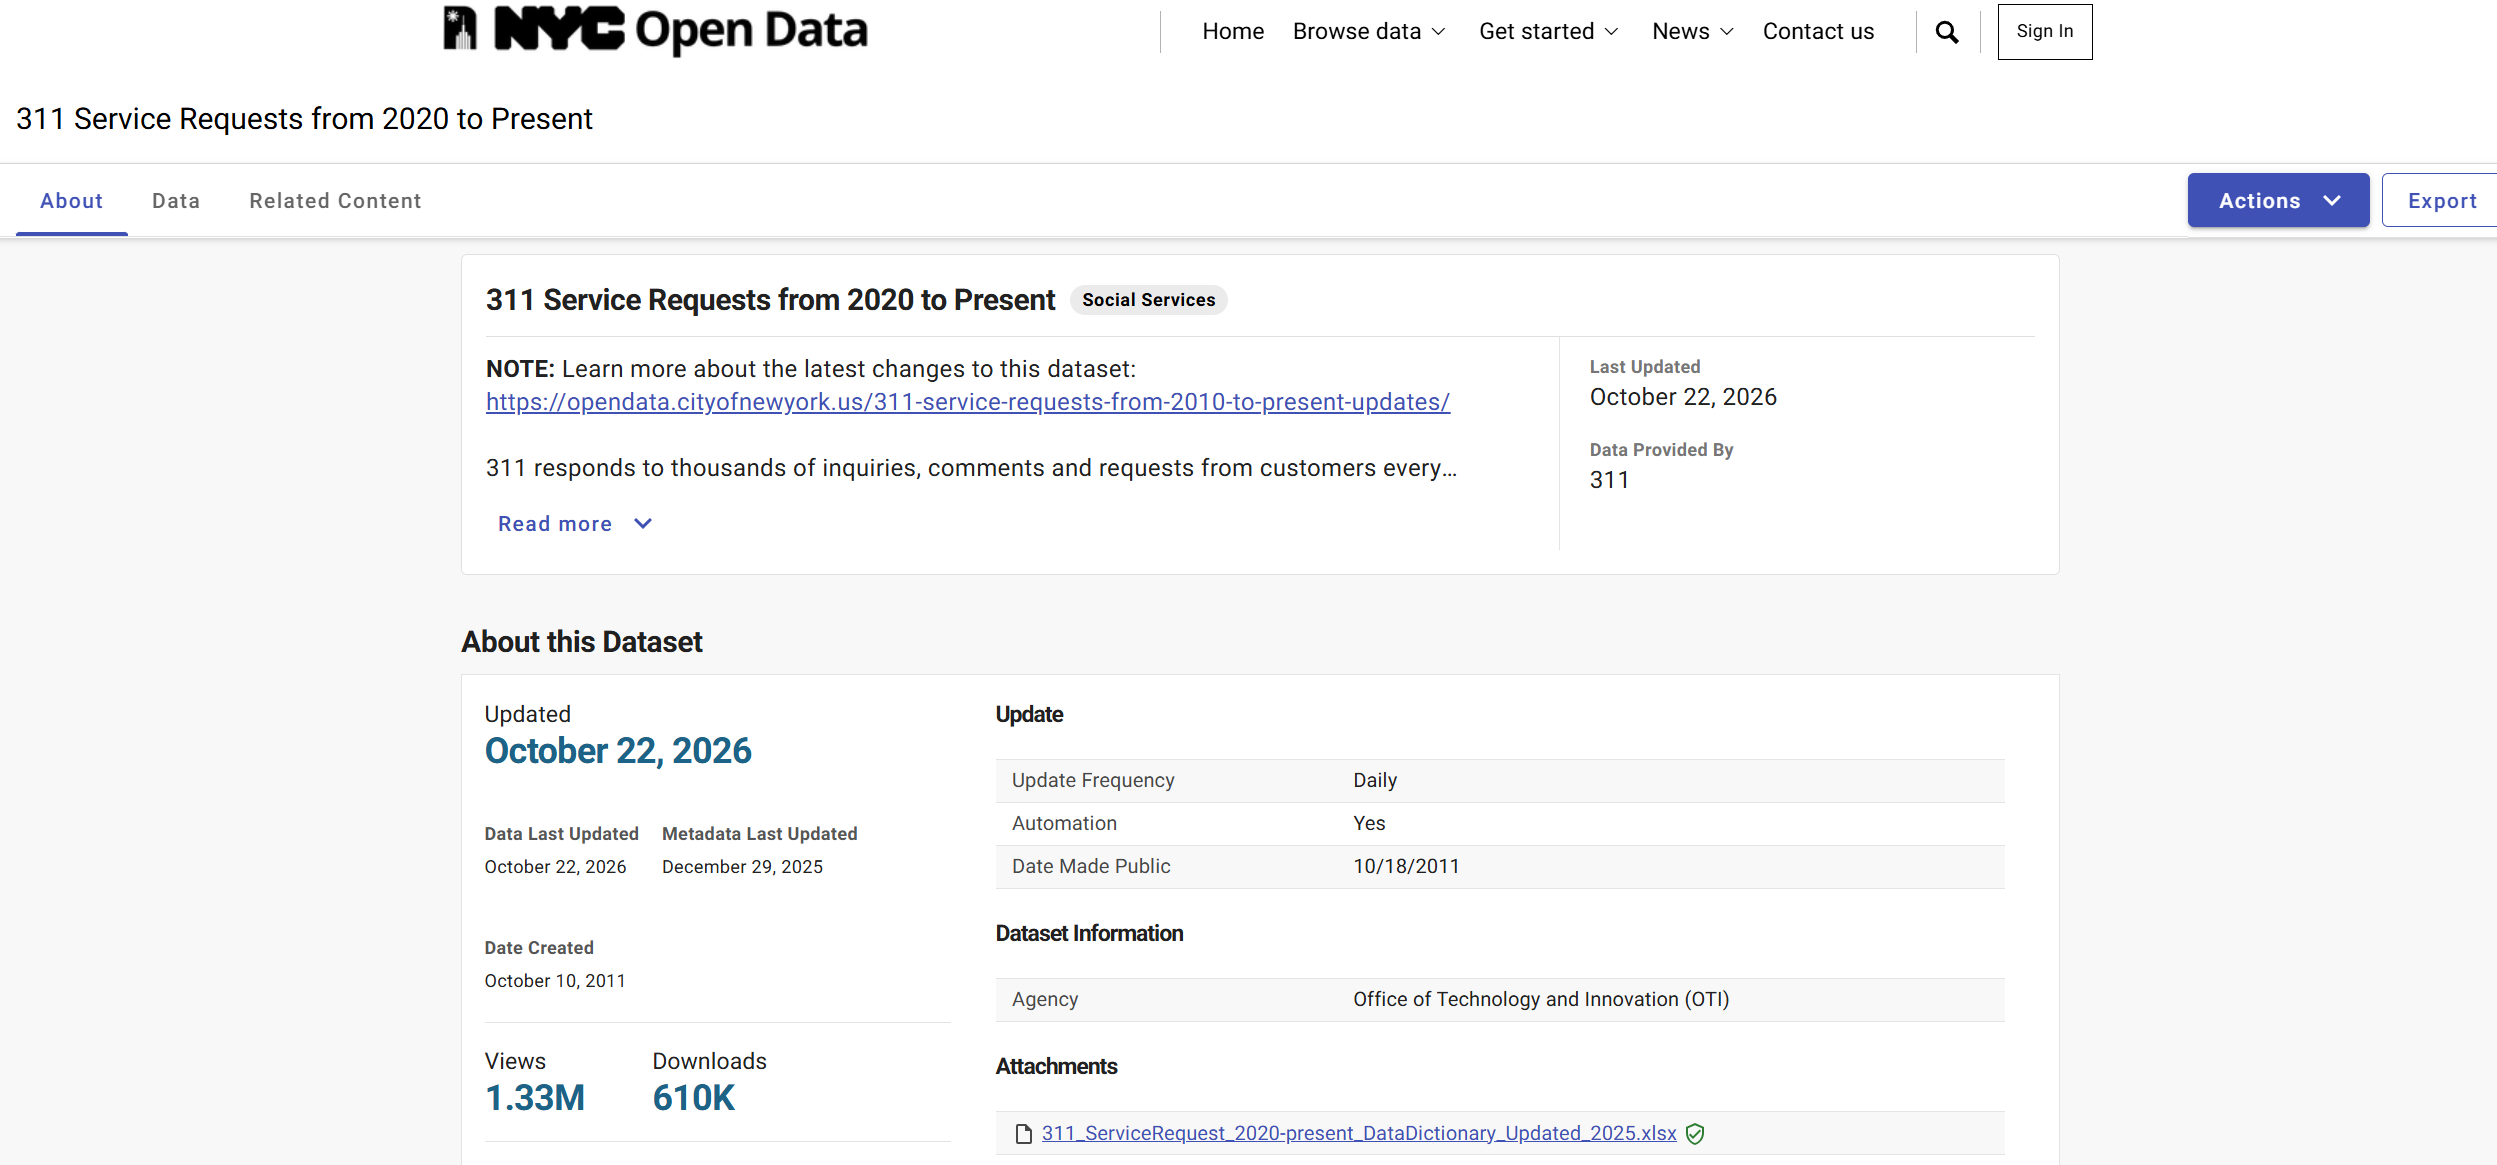
At first, I wanted to make a map about pigeons, so I searched NYC Open Data. The available pigeon data mainly recorded complaints. People reported that there were too many pigeons or that they were leaving waste in public places. This made me wonder why pigeons gather in these locations.
I then watched several videos about pigeons in New York City. I learned that pigeons look for food, so they often gather near street vendors and restaurants. They also rest on the windowsills of older buildings. Parks provide more open space away from cars and busy streets.
Pigeons have their own reasons for liking these places. This idea became Coogle Maps: a map where pigeons can leave their own reviews.
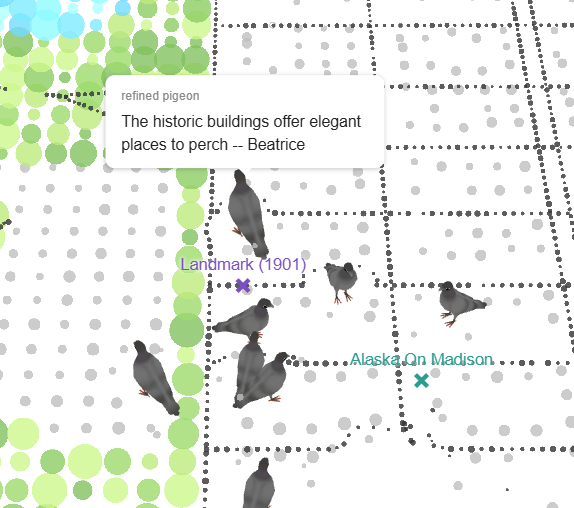
To generate each review, I collected more open data about the environment around a complaint location. Nearby restaurants, trash cans, buildings, parks, common places, coffee shops, benches, and fountains provide the context for each pigeon’s comment.
Mapbox, Point Clouds, and WebGL
Point-Cloud Landscape
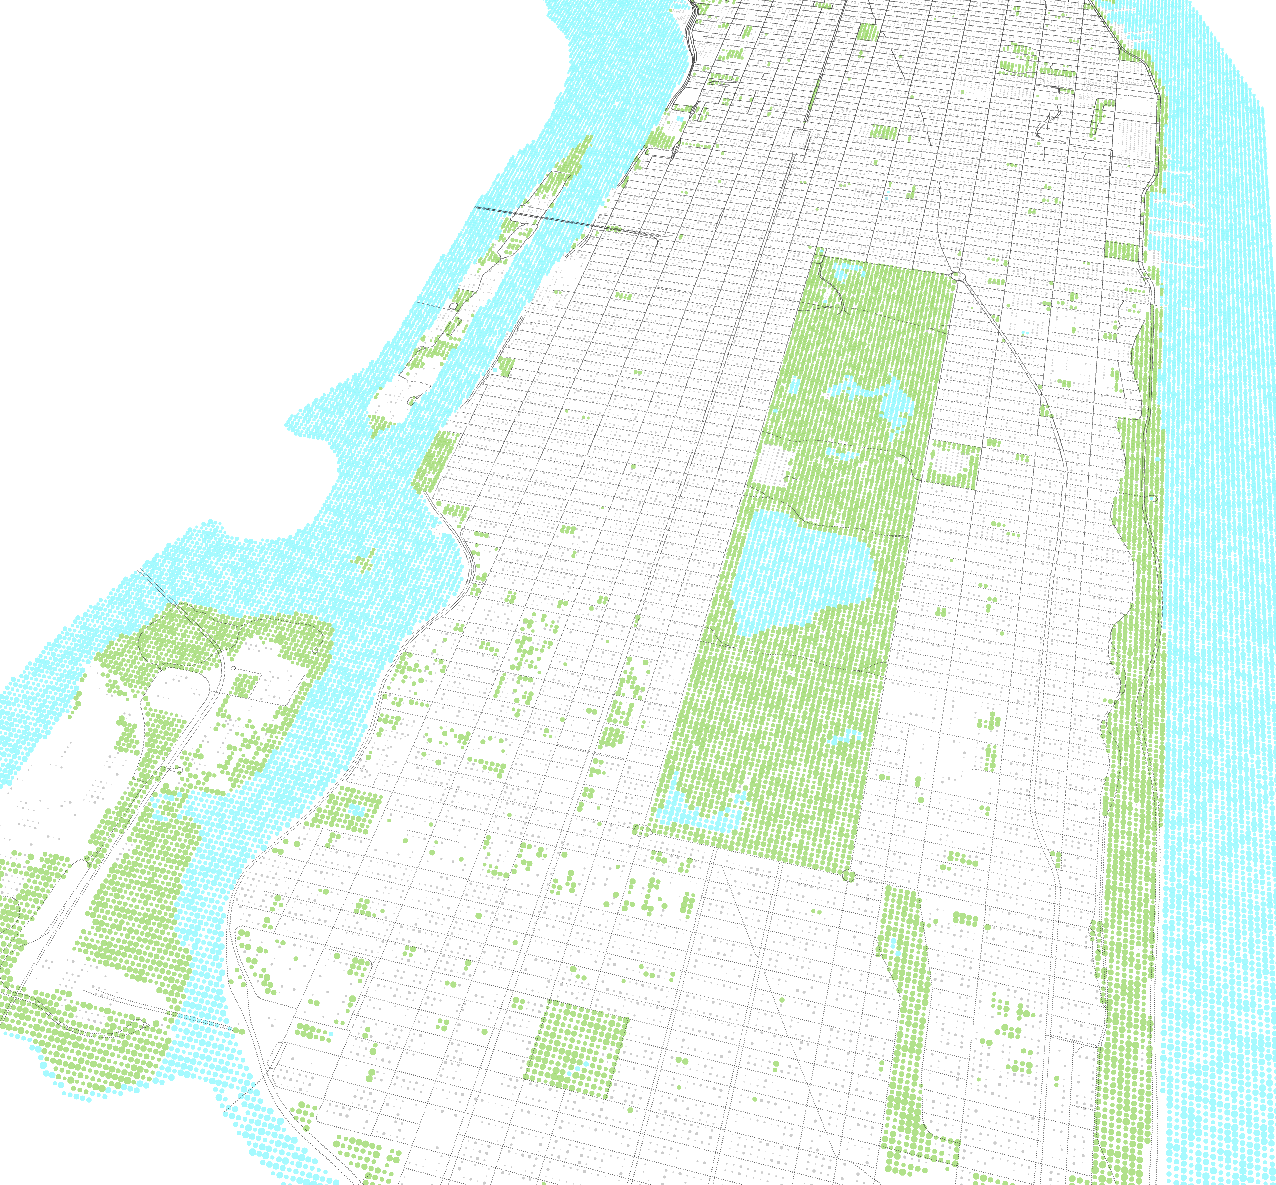
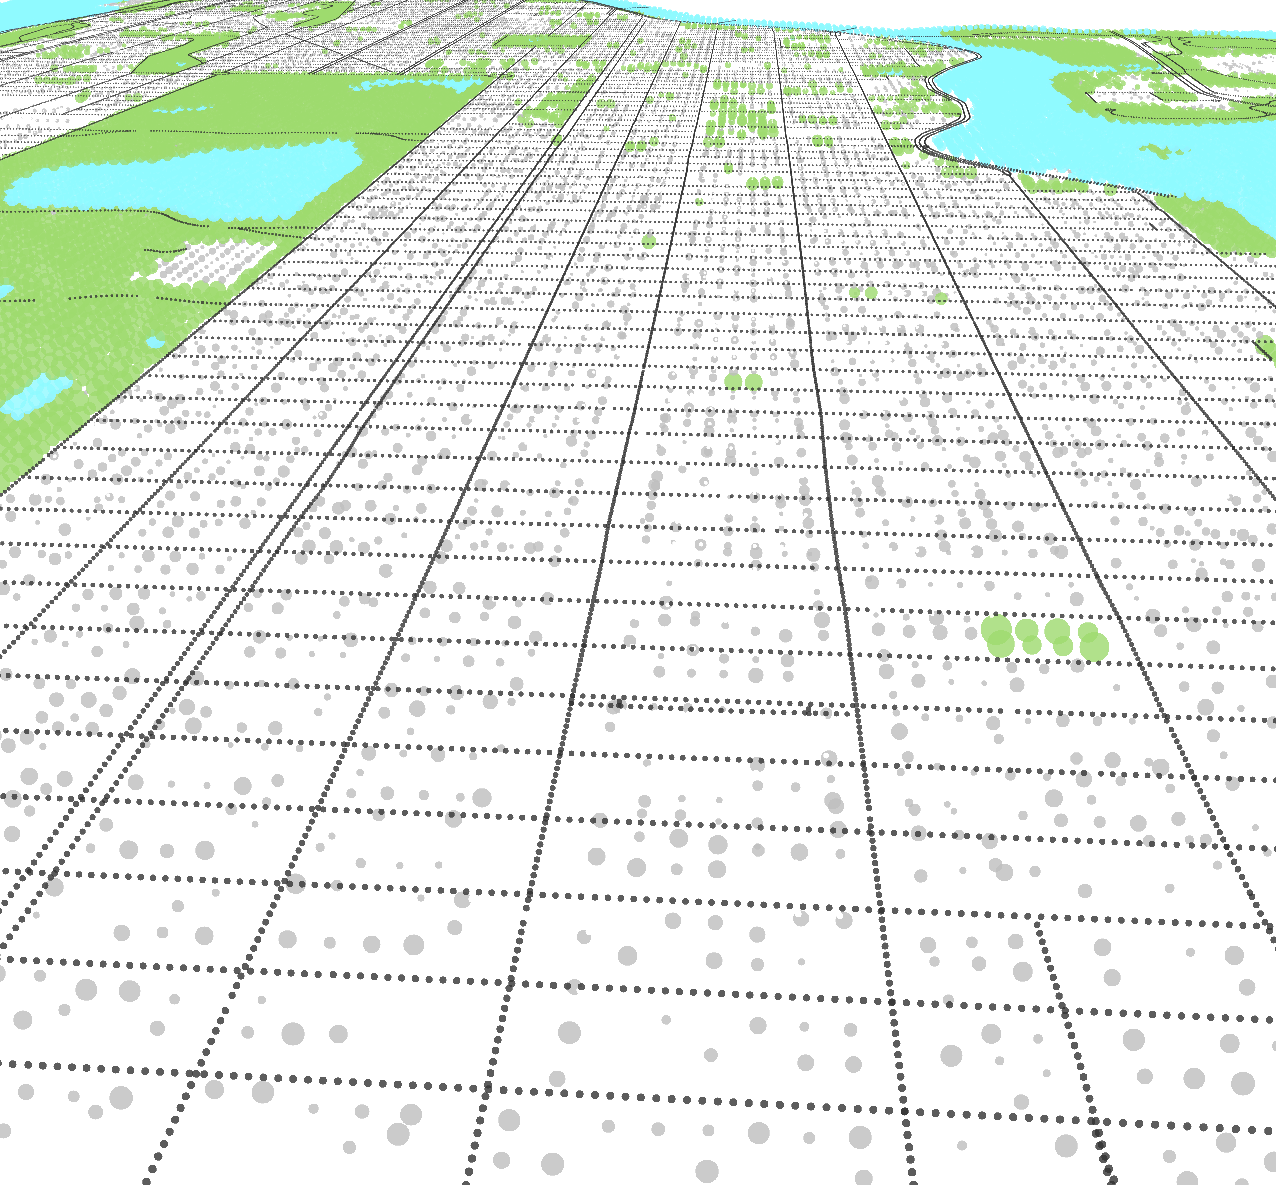
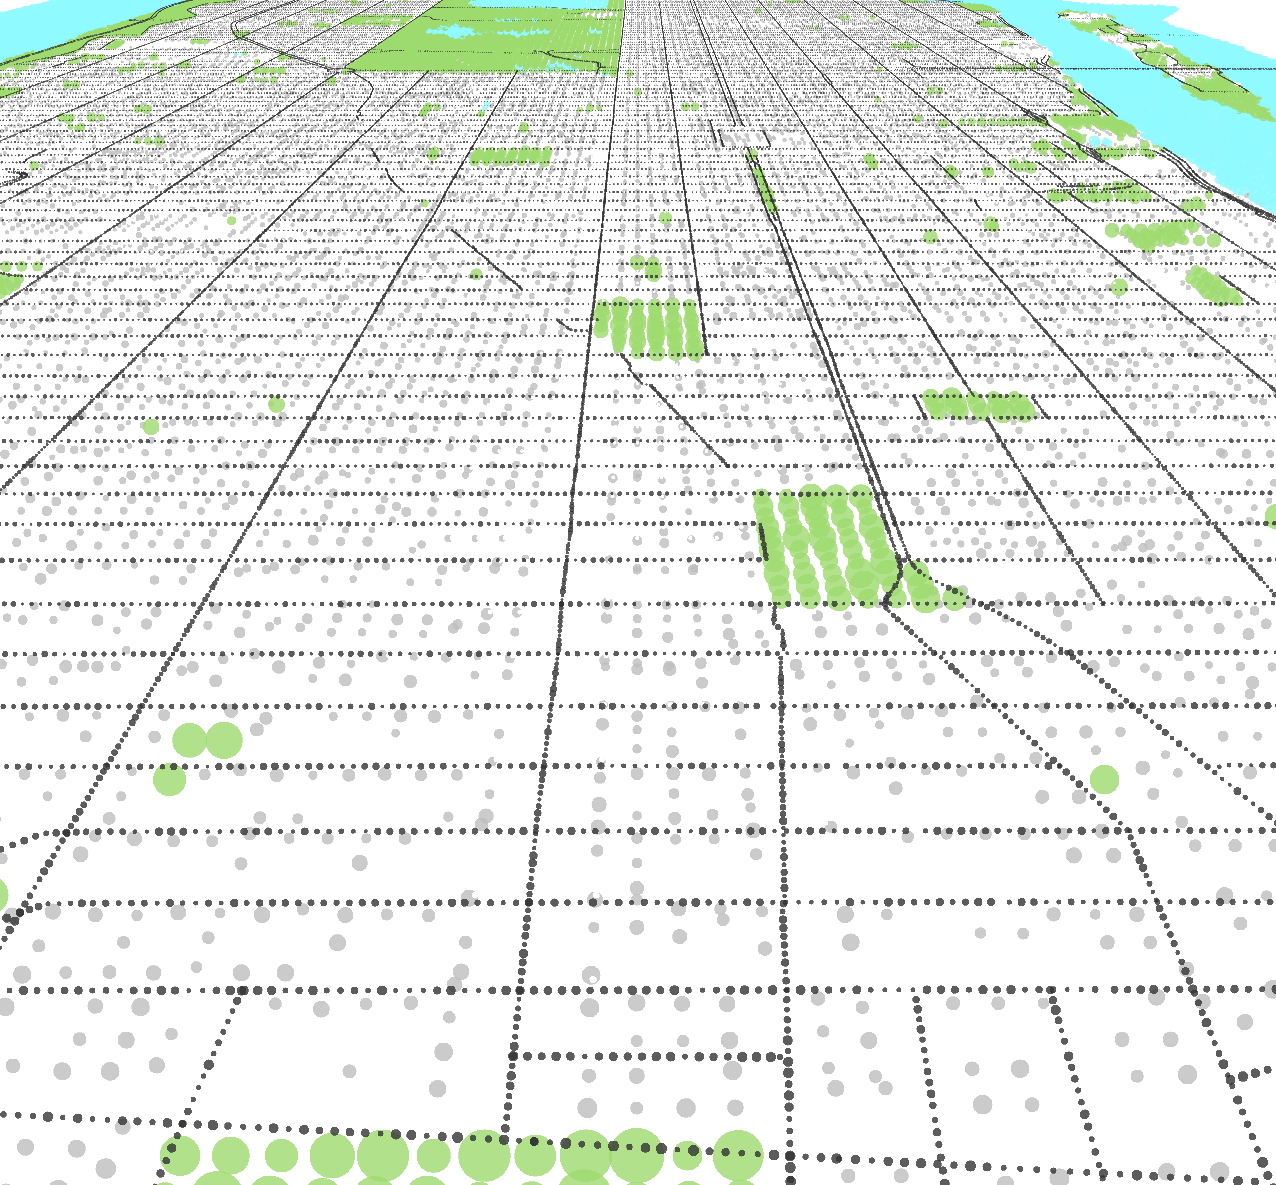
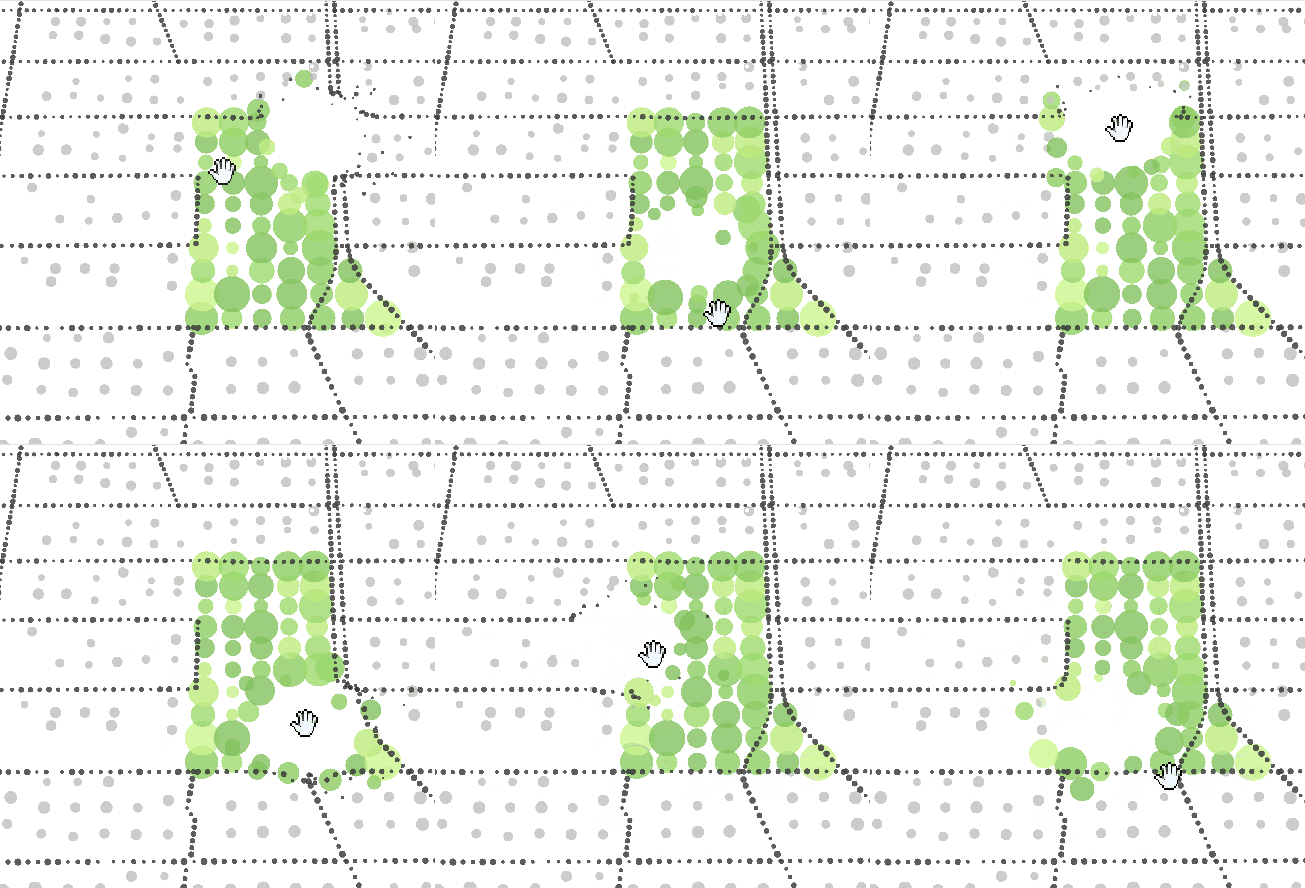
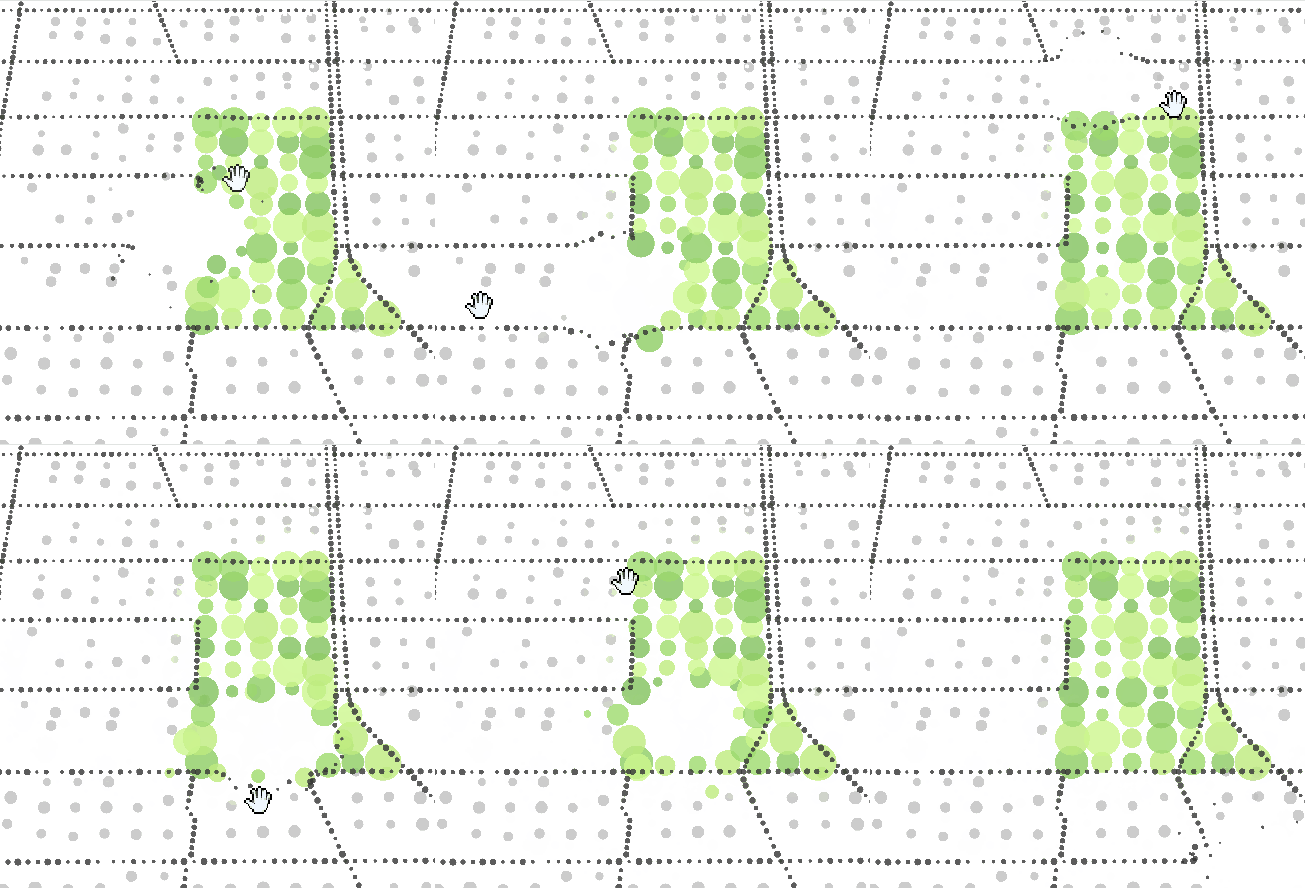
I chose a point cloud because I like its visual style. My master’s thesis in digital design explores 3D Gaussian Splatting and non-photorealistic rendering. A point cloud also keeps the map abstract and allows the pigeons to stand out.
View the watercolor-style point-cloud referenceMapbox Vector Tiles
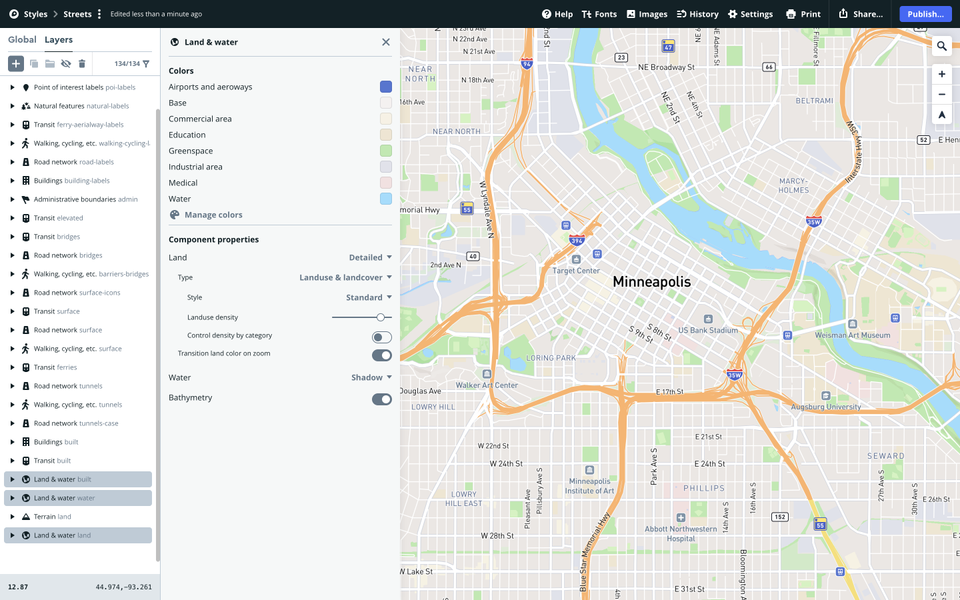
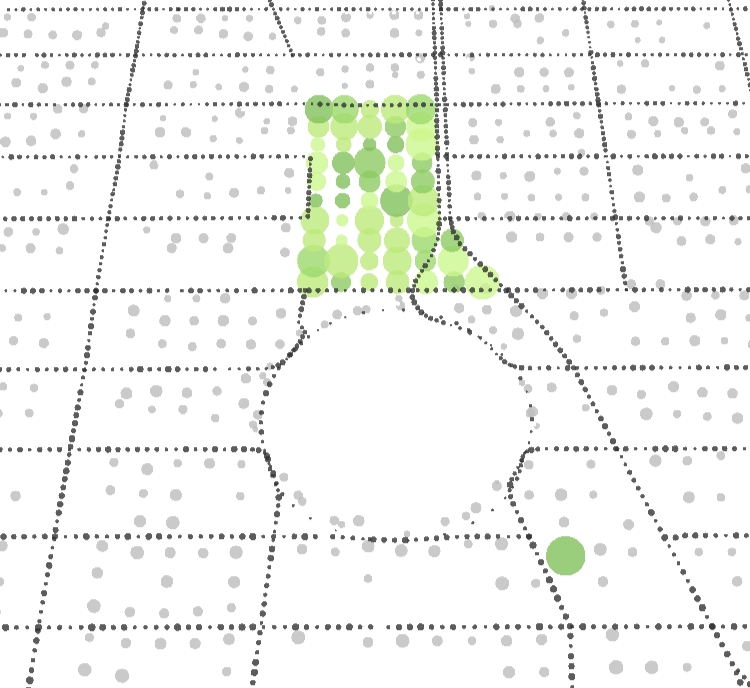
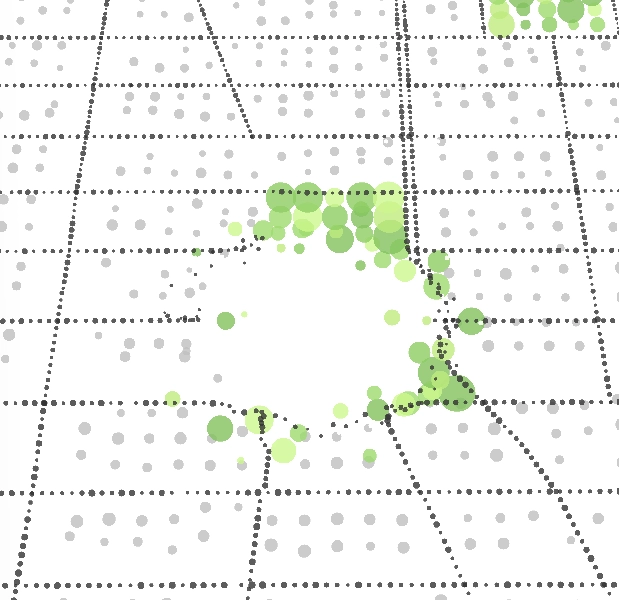
At first, I considered NYC LiDAR point clouds, NYC 3D mesh models, OpenStreetMap, and Mapbox as geometry sources. Because the project needed to run in a web browser and only required a simple visual language, I selected Mapbox. Its vector tiles provide geographic features such as buildings, roads, parks, and water. I can render these features as points and control their colors and positions.
Animated Pigeons in WebGL
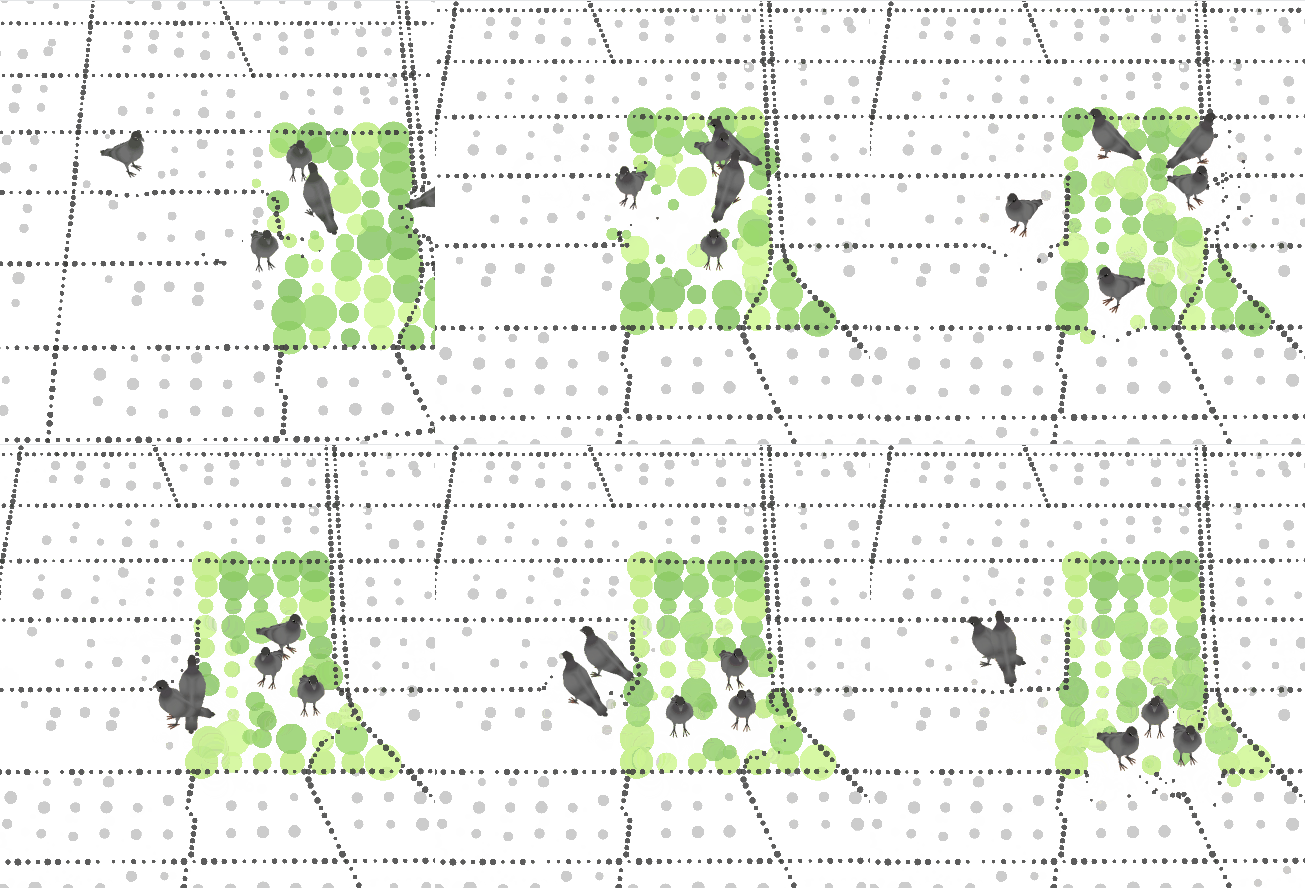
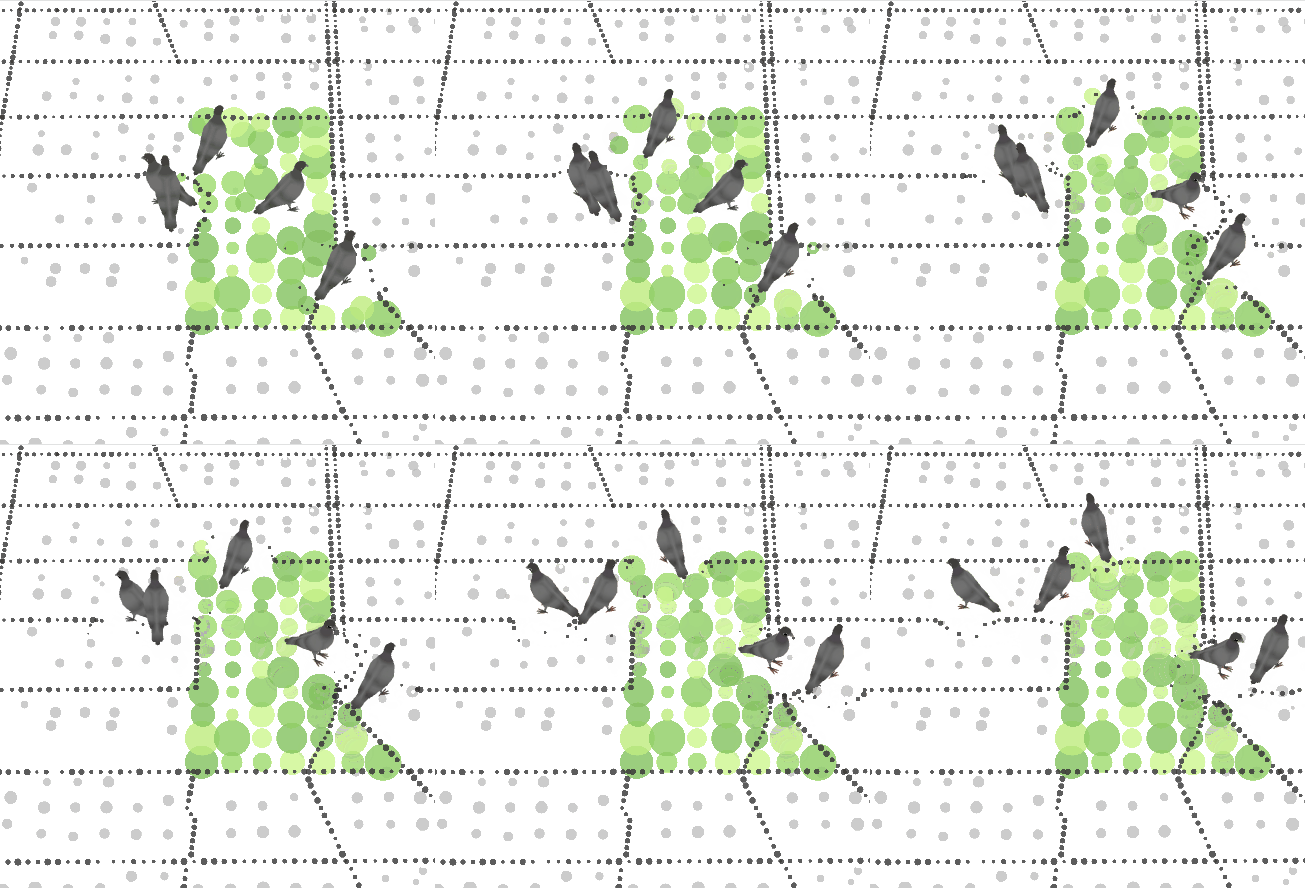
I used a 3D pigeon model because I wanted pigeons to walk around the map. I reused the model from an earlier study and used a sine function to move each pigeon’s body gently up and down.
Generating Pigeon Reviews with a Codex Skill
I wrote a reusable pigeon-map-comment-writer skill to define how the pigeon reviews should be written. GPT-5 produced 3,630 individual reviews through this system instead of receiving a separate prompt for every location.
The current version asks for natural B1–B2 spoken English, one short sentence before a pigeon name, varied personalities and emotional tones, realistic urban pigeon behavior, and careful use of the supplied location data. It also prevents unsupported places, dates, facilities, or local conditions from being added. Every output must use valid JSON.
{
  "id": "c-27_-52",
  "comments": [
    {
      "text": "I patrol near Chipotle because fast food means fast pecking -- Zippy",
      "persona": "hyper teenage pigeon",
      "uses": ["c-27_-52-4"]
    }
  ],
  "model": "gpt-5",
  "prompt_version": "v2"
}
Landmarks and Complaint Locations
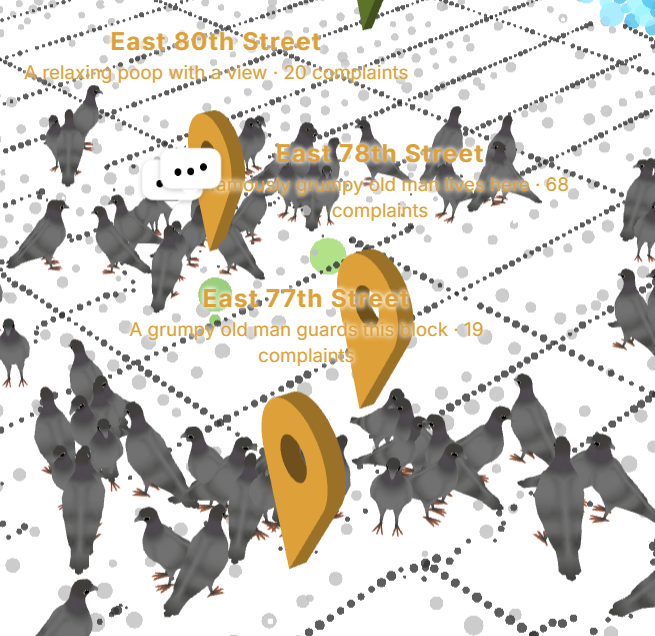
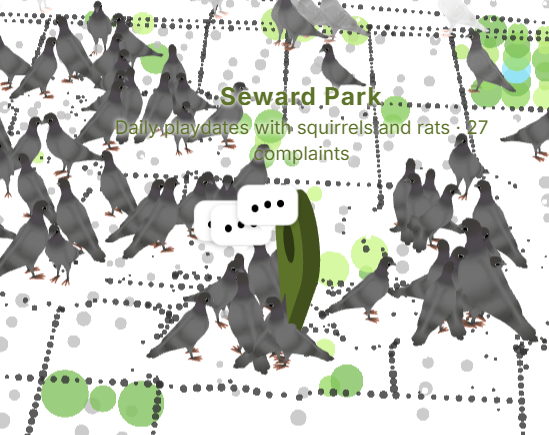
Small black pins show familiar tourist landmarks and help viewers understand their position. Colored pins identify the twenty locations with the most pigeon complaints and display pigeon-style explanations.
Data and Sound
The interaction combines the visual map with a pigeon sound effect and the collected urban datasets.
Listen to the pigeon sound source on Freesound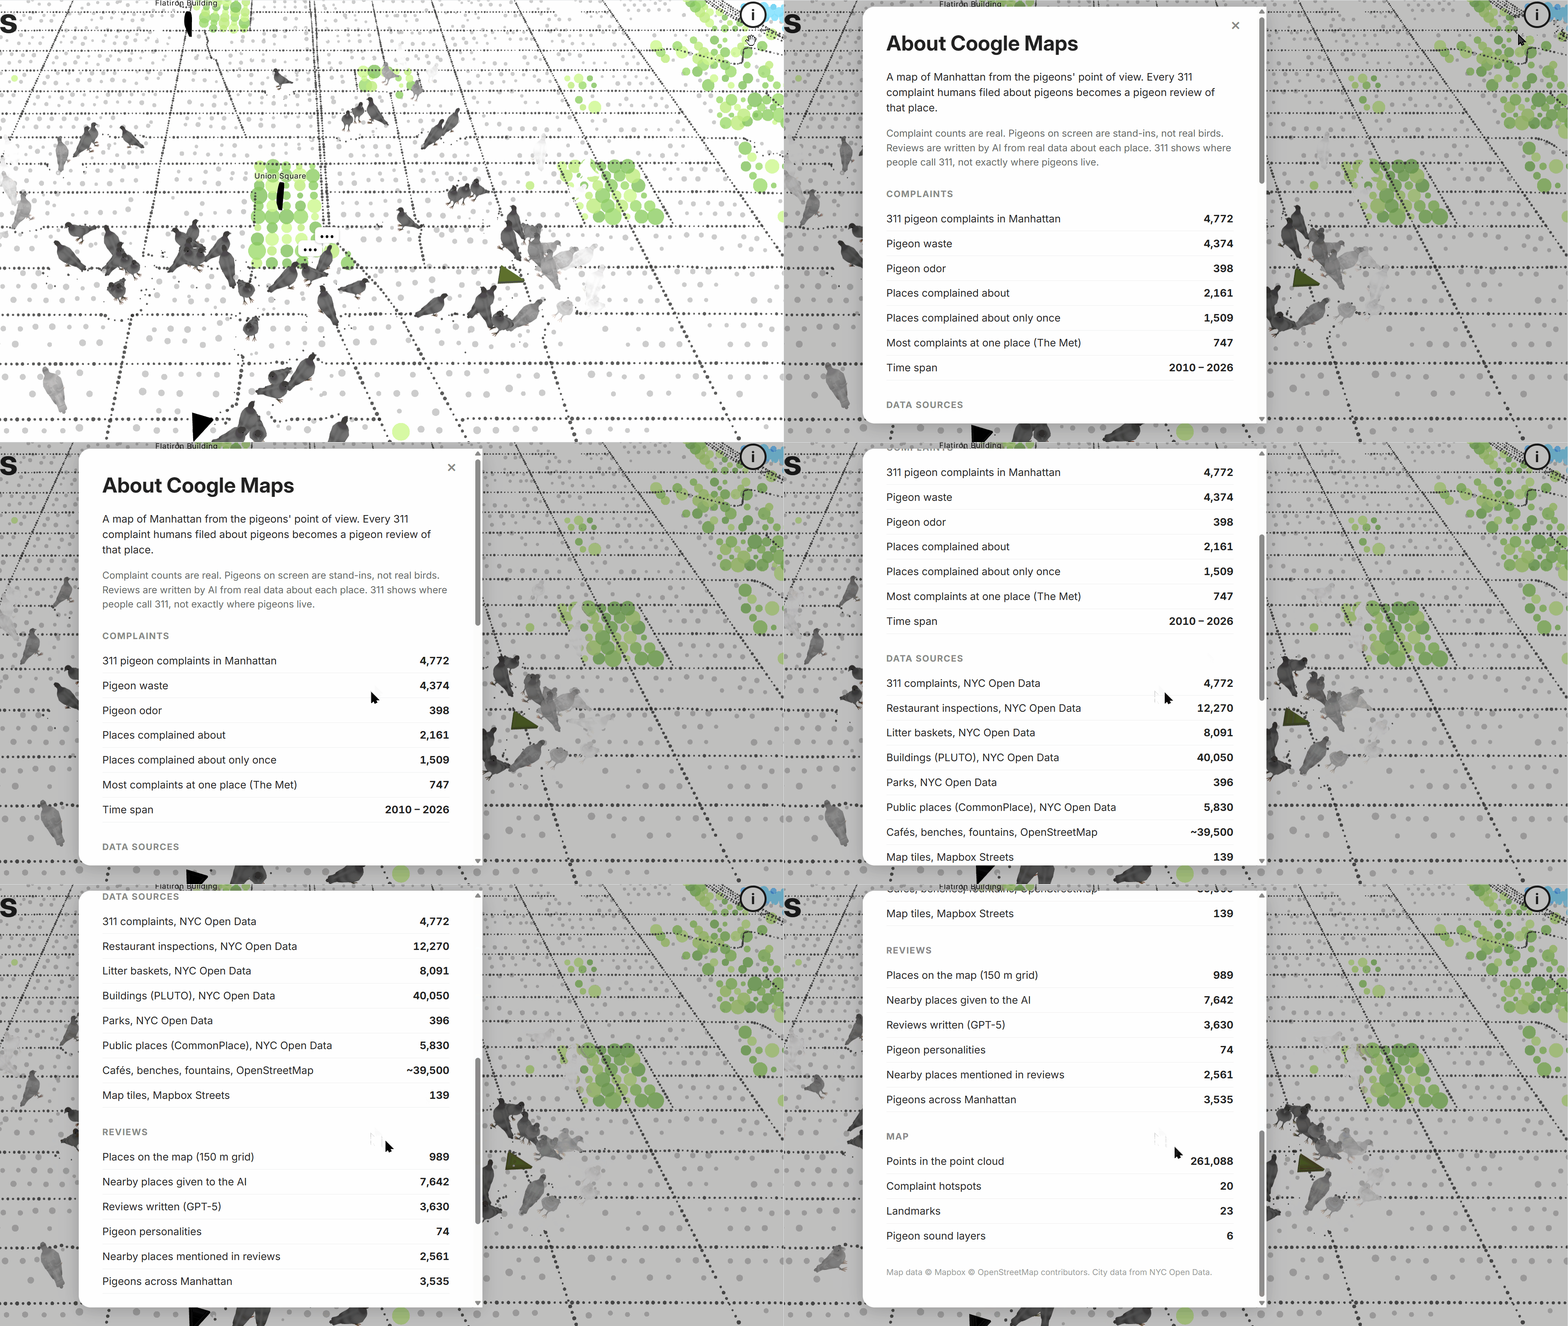
Development Process
I first built a simple p5.js prototype and prepared the initial map references. Claude then revised the prototype and implemented most of the remaining technical details based on my directions and feedback.