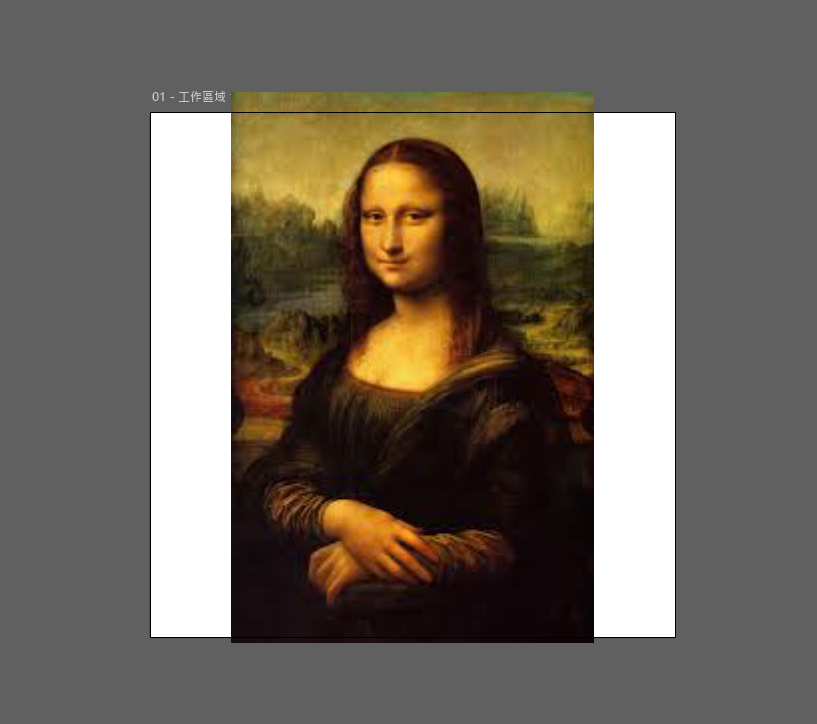
Mona Lisa Portrait Clock: Fourier Drawing and the Representation of Time
- 2026-10-01
- p5.js, Fourier Transform, Generative Drawing, Time
Mona Lisa Portrait Clock: Fourier Drawing and the Representation of Time
本文介紹一個將繪圖複雜度與時間連結的實驗性肖像時鐘。系統先將描繪的 Mona Lisa 轉換為二維點資料,再使用離散 Fourier transform,把路徑表示為一系列旋轉圓。相同的來源點可以透過不同數量的圓,在固定的繪圖時間中產生簡單或細緻的圖像。背景則取樣原圖顏色逐步建立,Fourier 路徑同時慢慢完成肖像。本研究探索數學表示、資料量與繪圖時間如何共同改變一張熟悉圖像的視覺經驗。
This article presents an experimental portrait clock that connects drawing complexity with time. The system converts a traced Mona Lisa into two-dimensional point data and applies a discrete Fourier transform to represent the path as rotating circles. The same source points can produce simple or detailed drawings by changing the number of circles used during a fixed drawing period. Image colors are sampled to build a layered background while the Fourier path gradually completes the portrait. The study explores how mathematical representation, data amount, and drawing time can shape the visual experience of a familiar image.
Inspiration
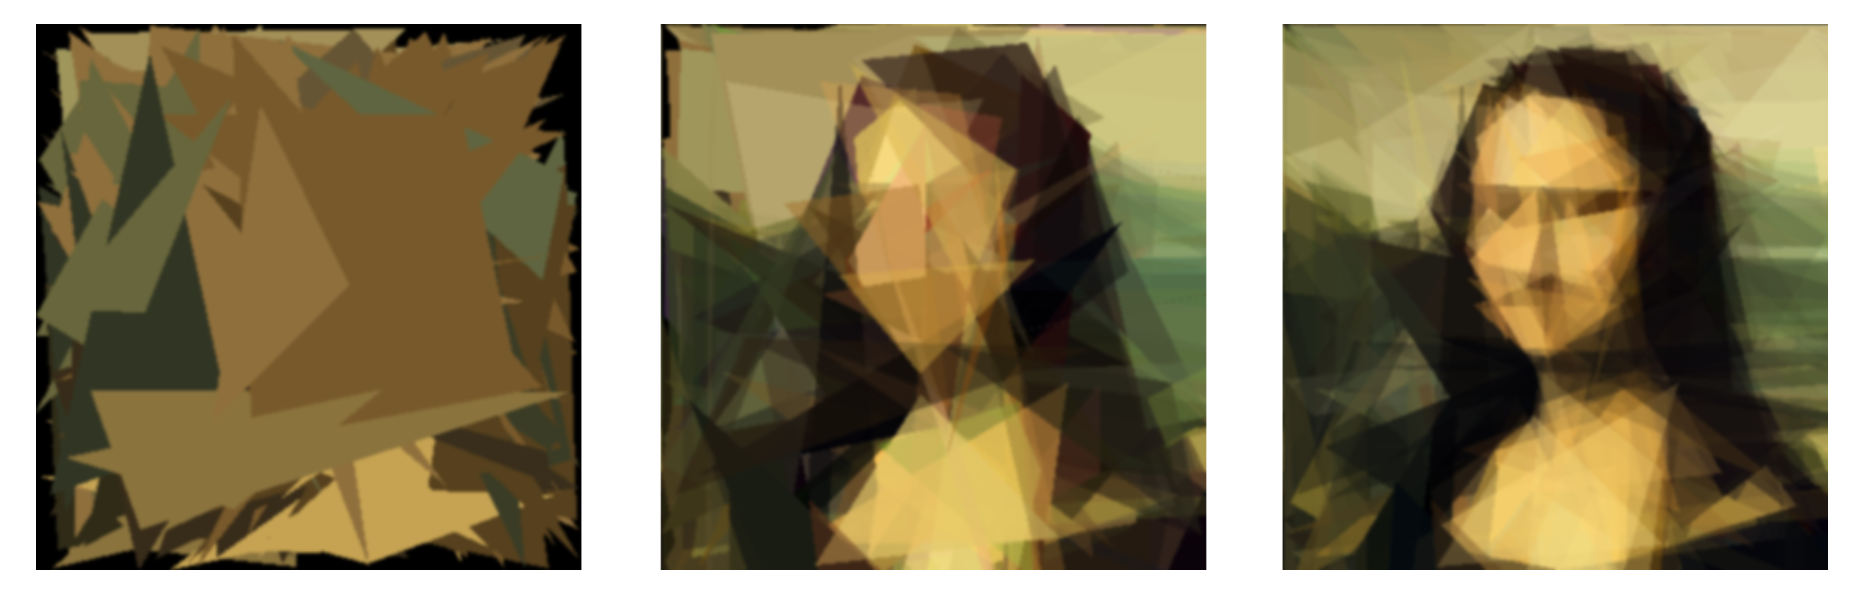
The project was inspired by an experiment that reconstructs the Mona Lisa over time. I wanted to connect this idea with Fourier drawing and use the amount of available time to control how much detail appears.
Result and Reflection
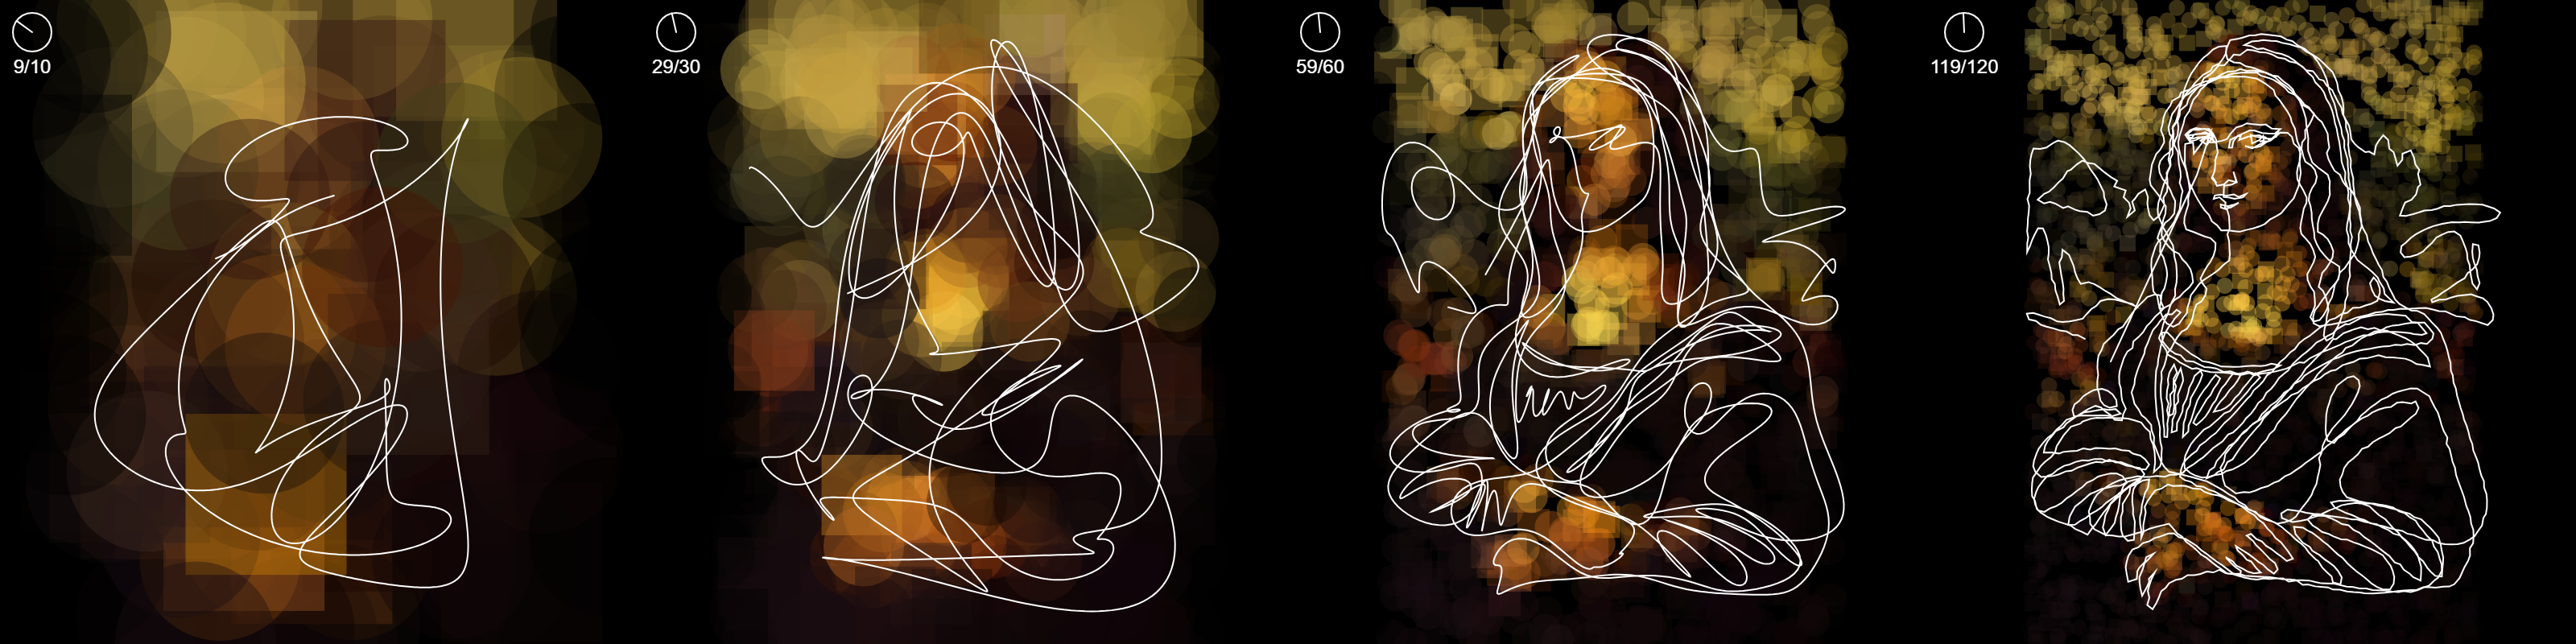
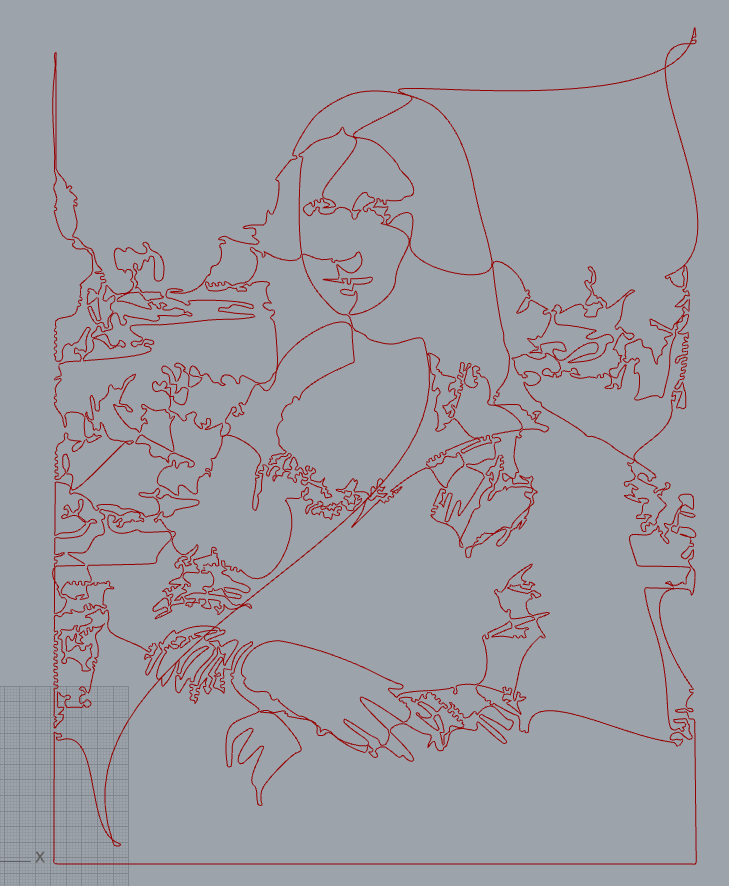
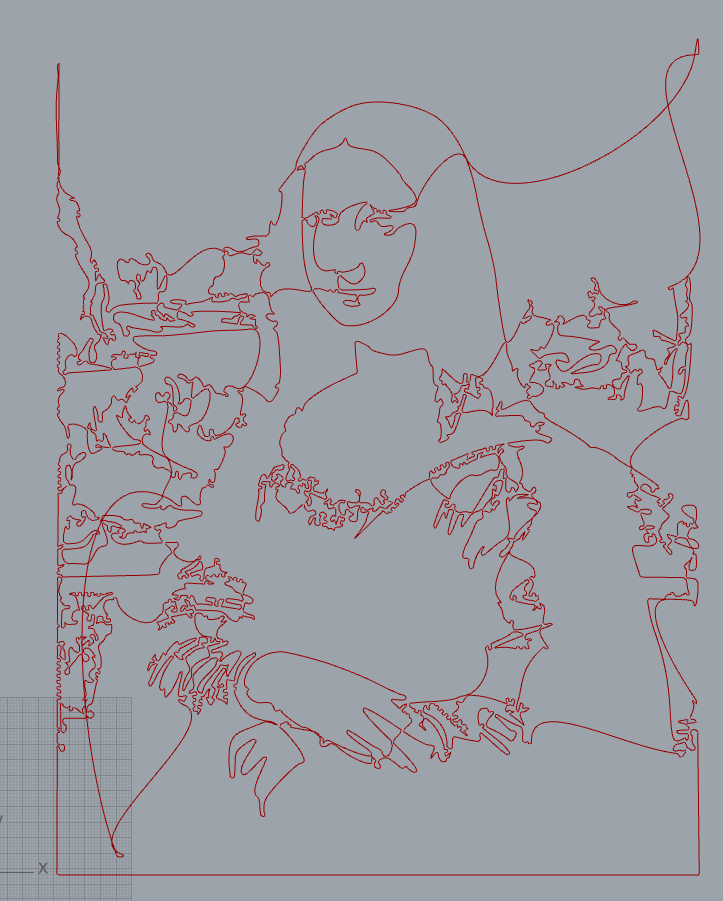
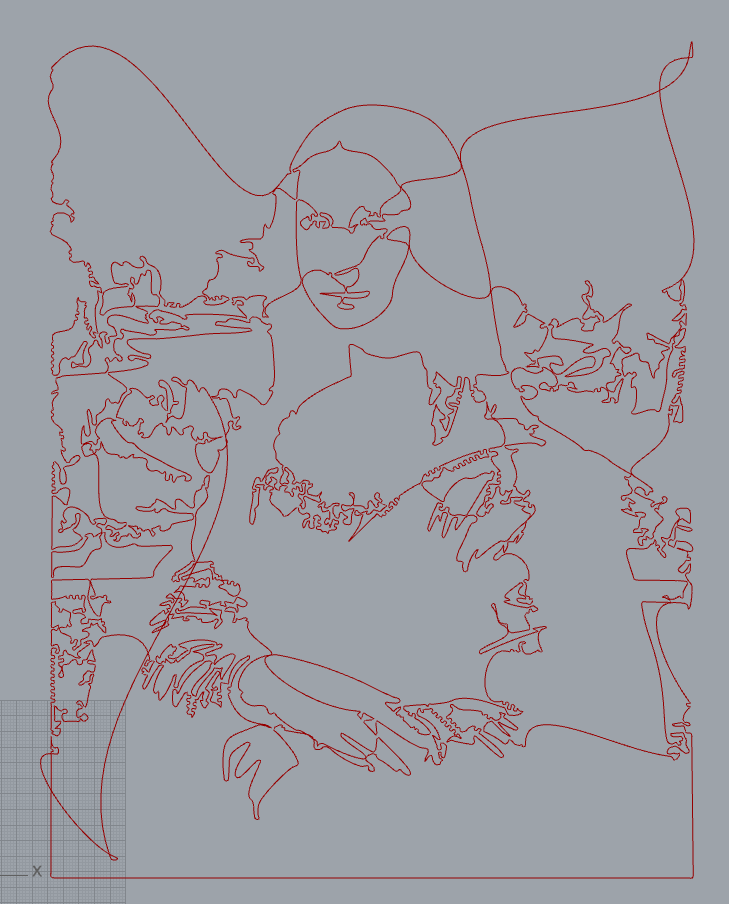
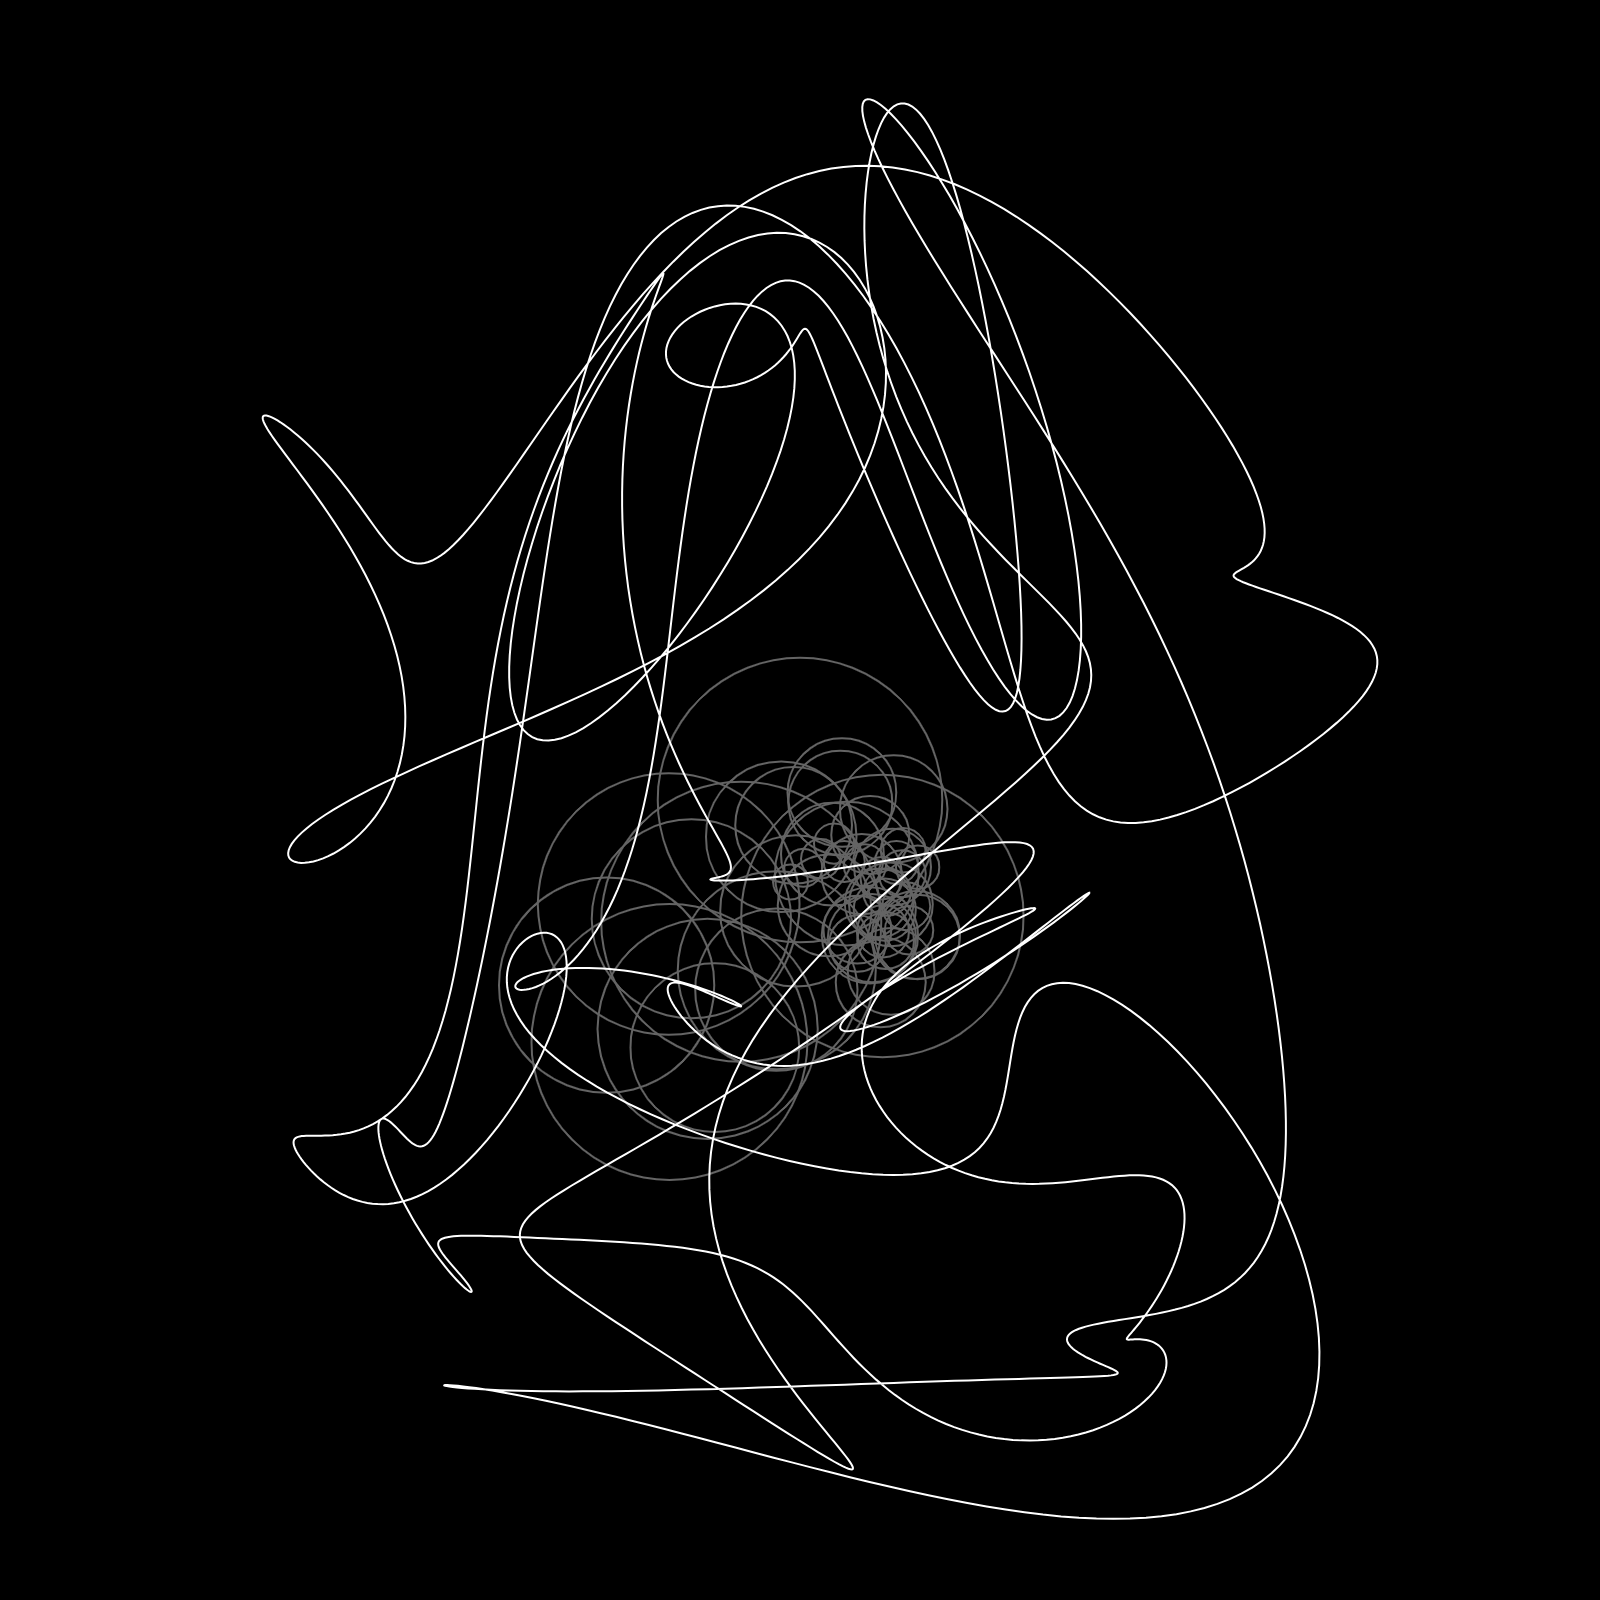
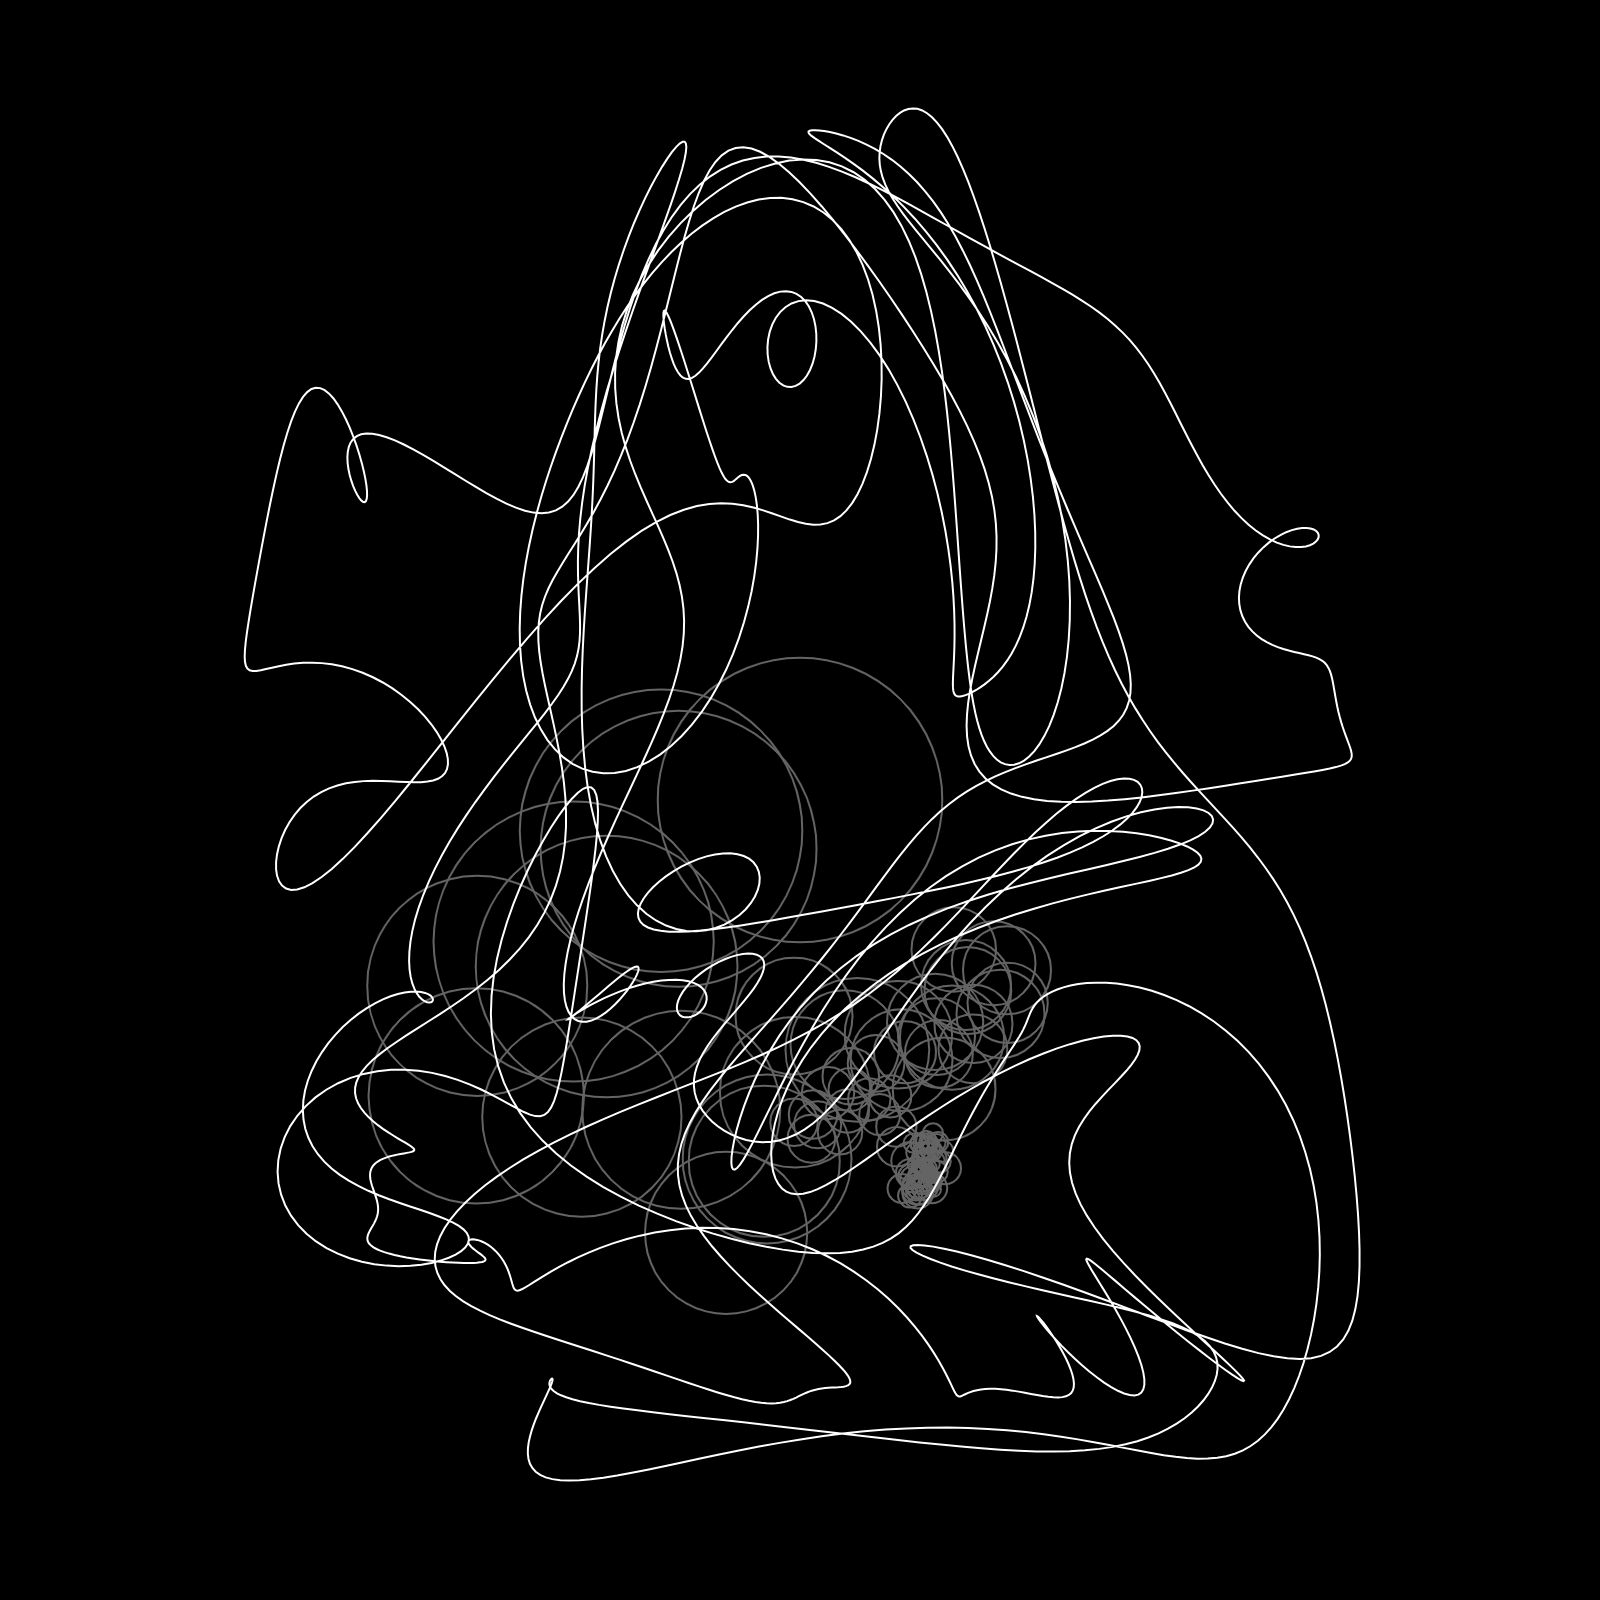
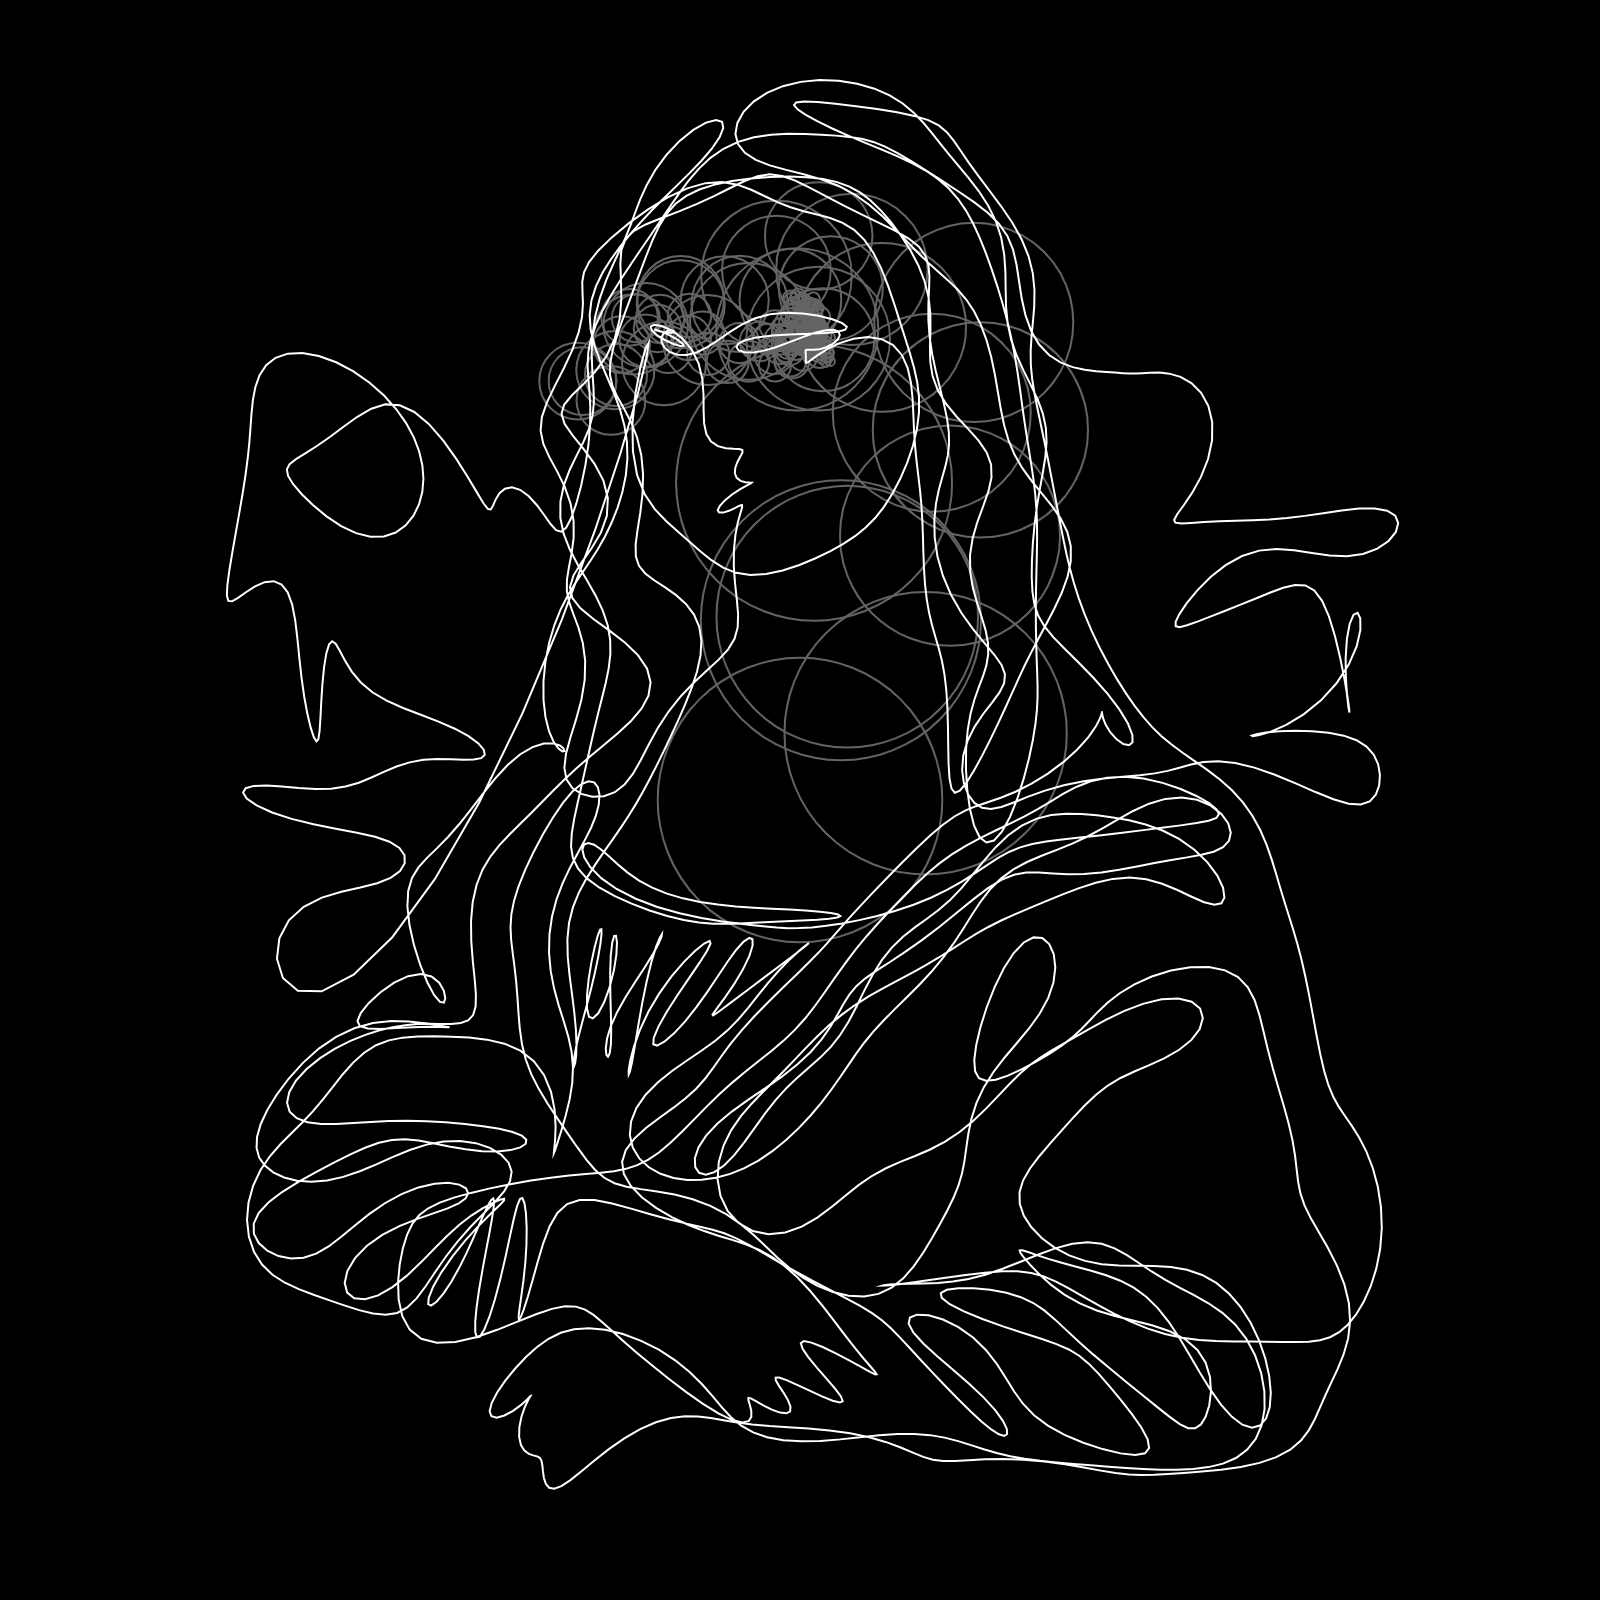
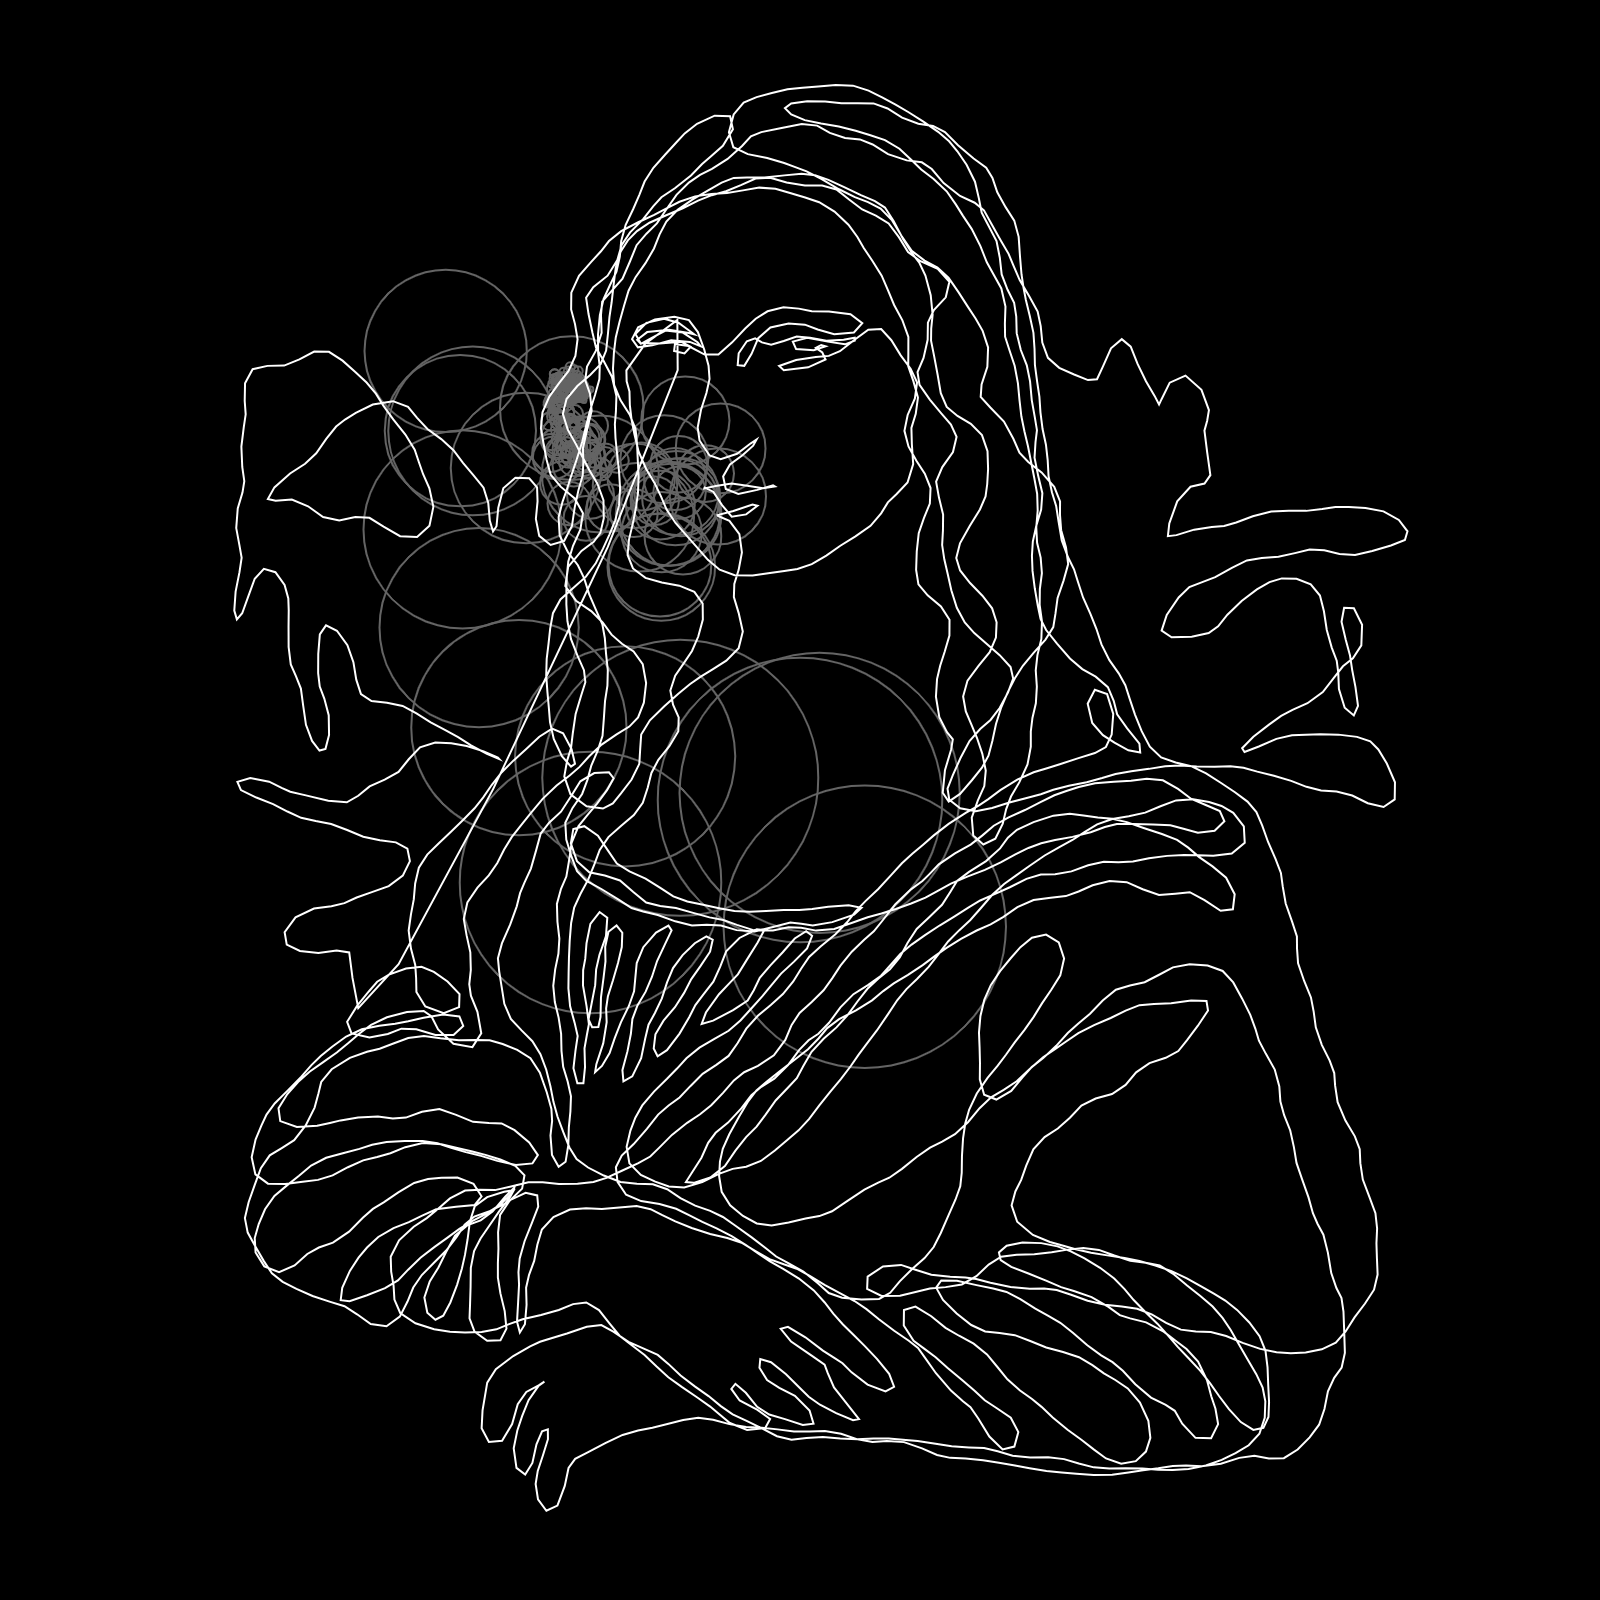
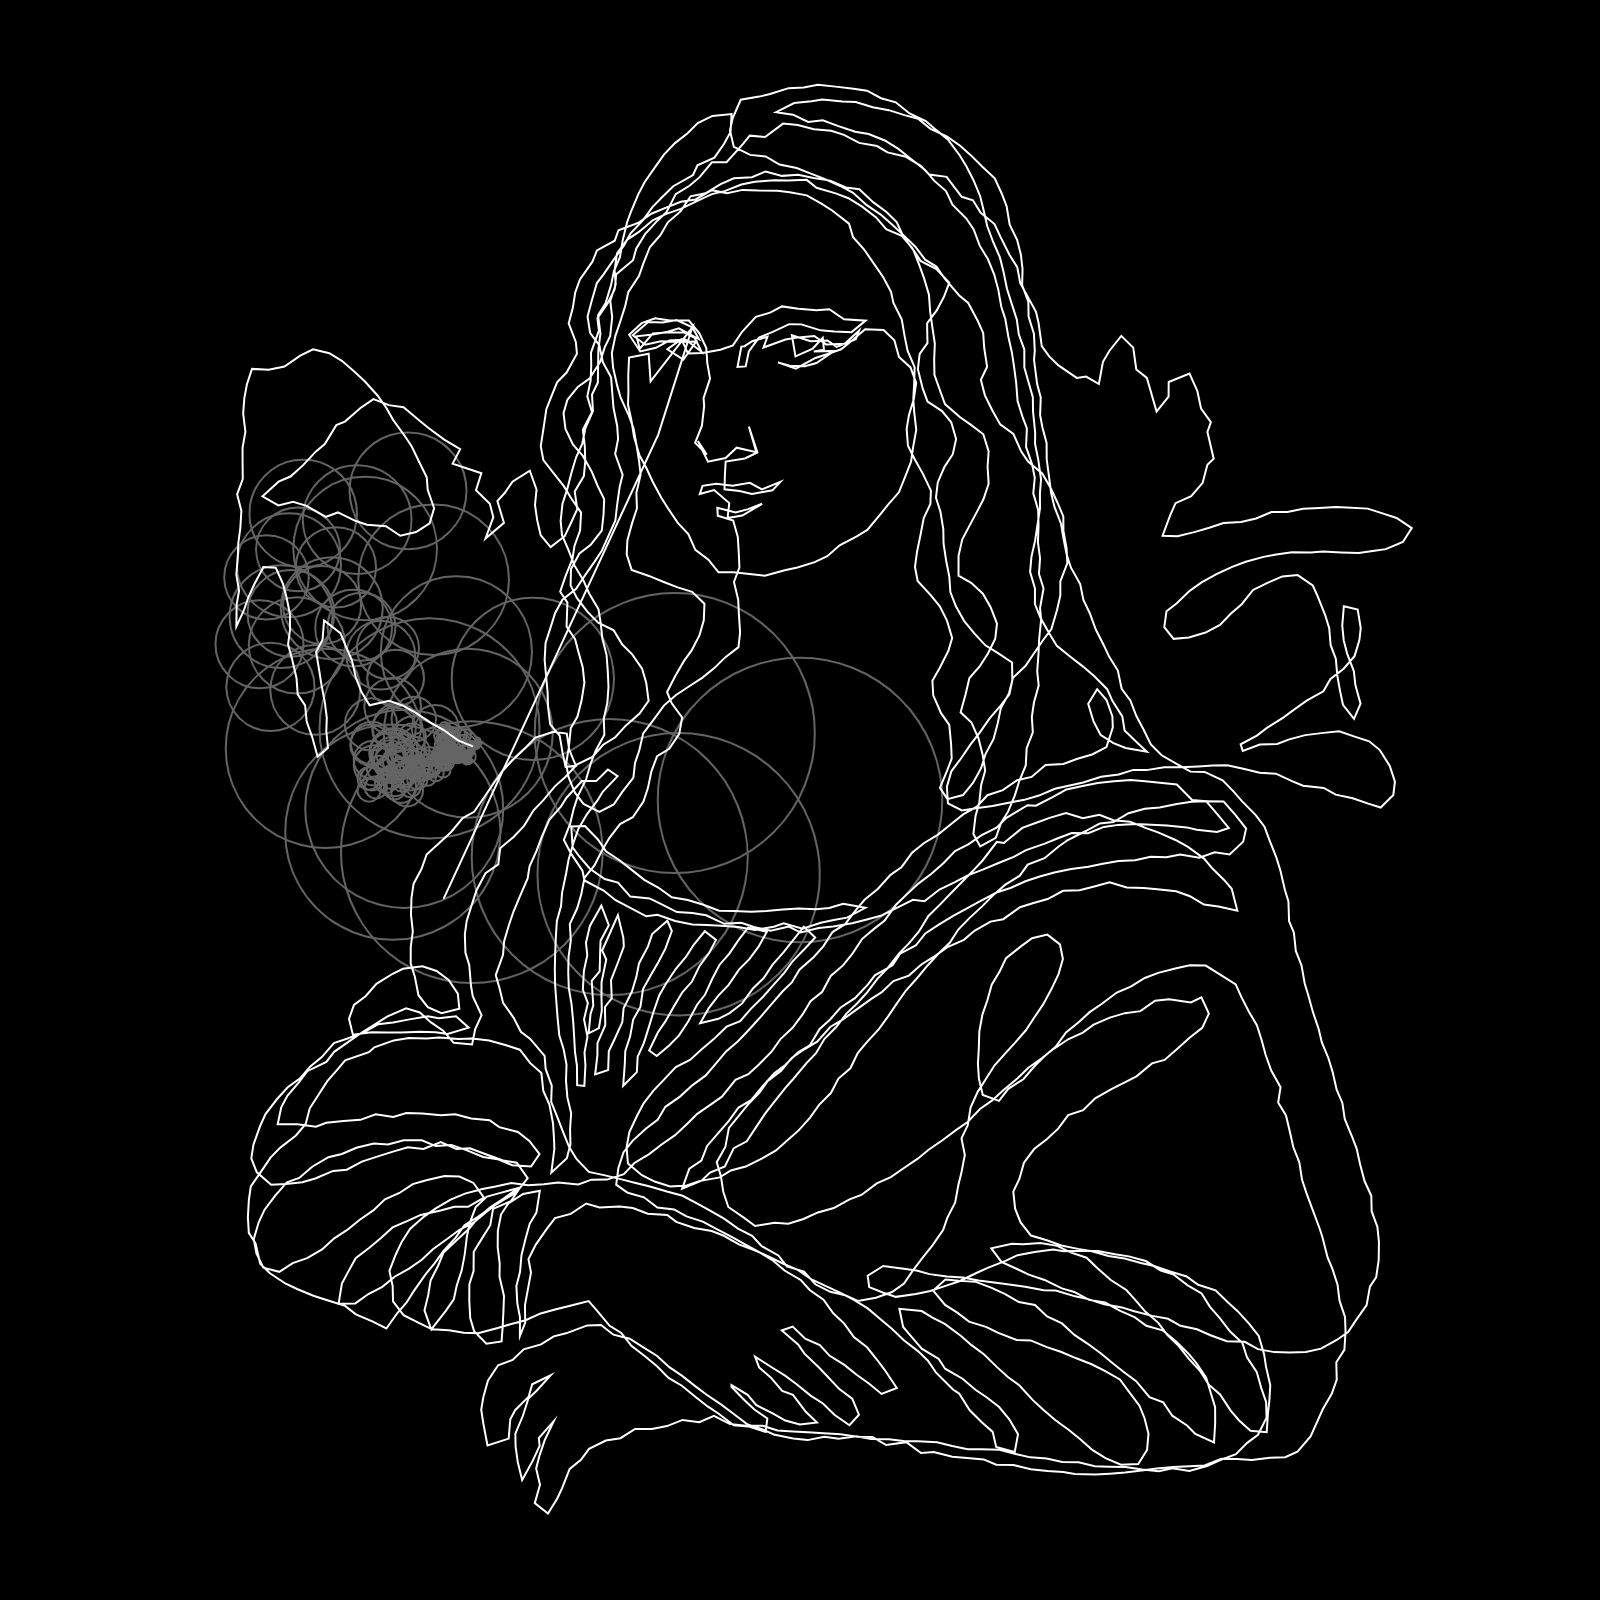
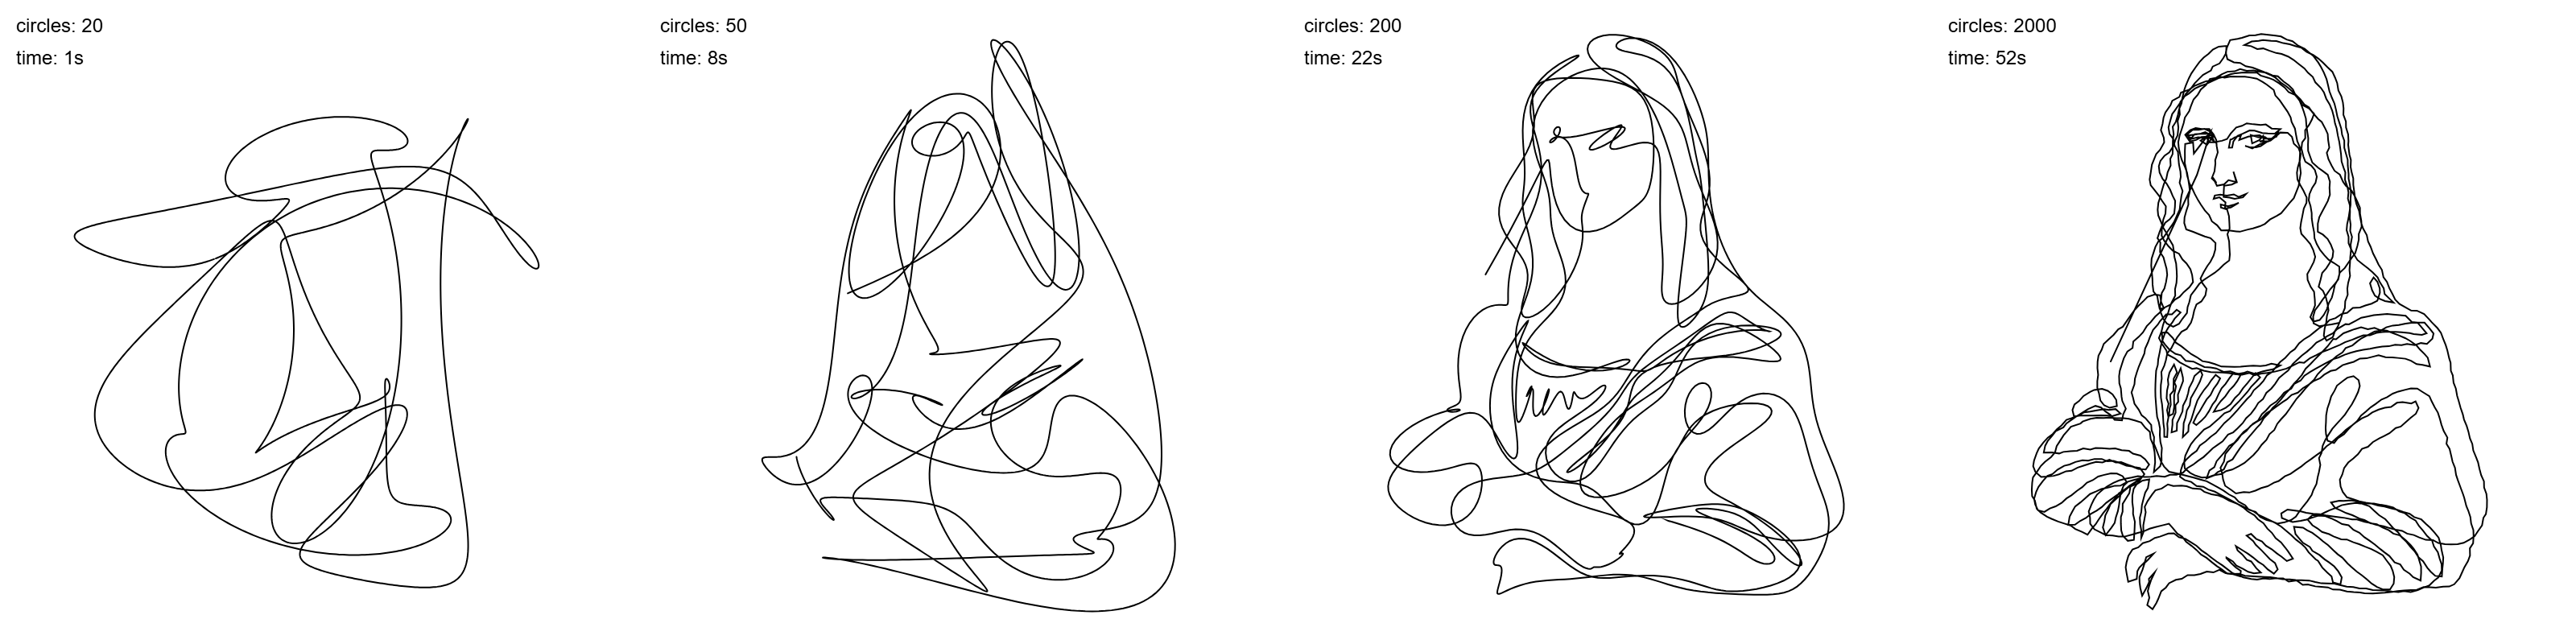
This experimental clock studies the connection between drawing and time. A short period produces a simpler drawing, while a longer period produces a more complex and detailed portrait. All four drawings use the same source points. A Fourier transform converts these points into rotating circles, and the number of circles controls the visual complexity.
The project helped me connect the visual process of drawing with the mathematical calculation of a Fourier transform. It also showed how the amount of data can directly affect the result. In a future version, I would like to choose a different number of circles for each run and use irregular color shapes to build the background more gradually.
Understanding Fourier Series
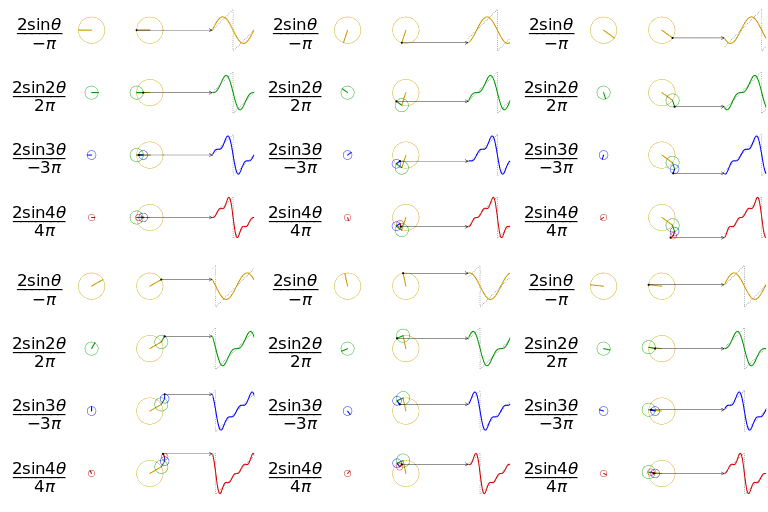
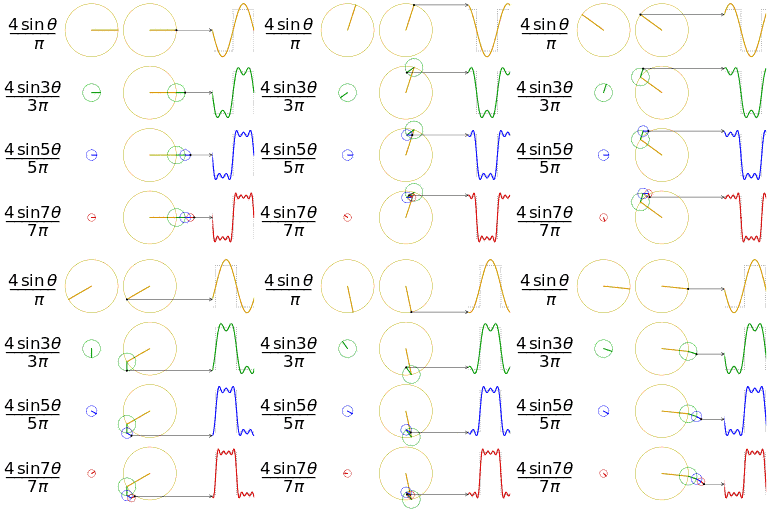
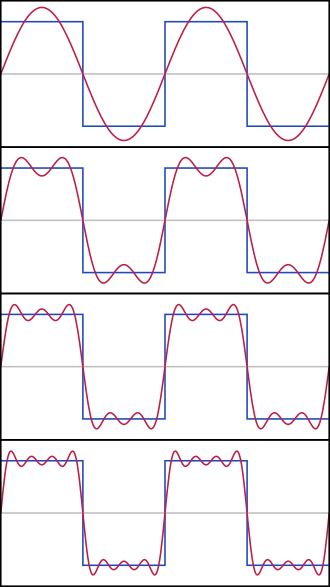
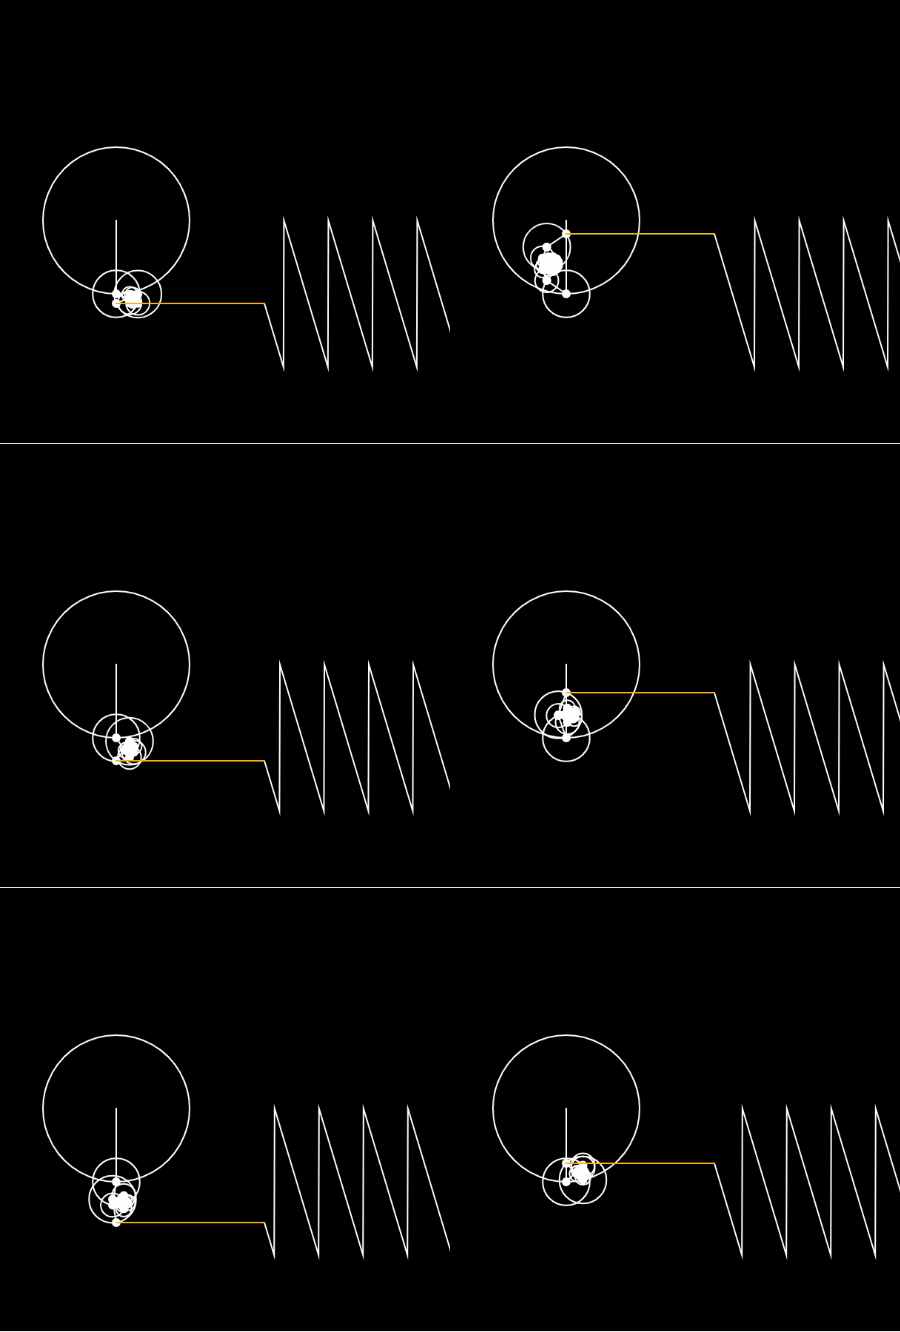
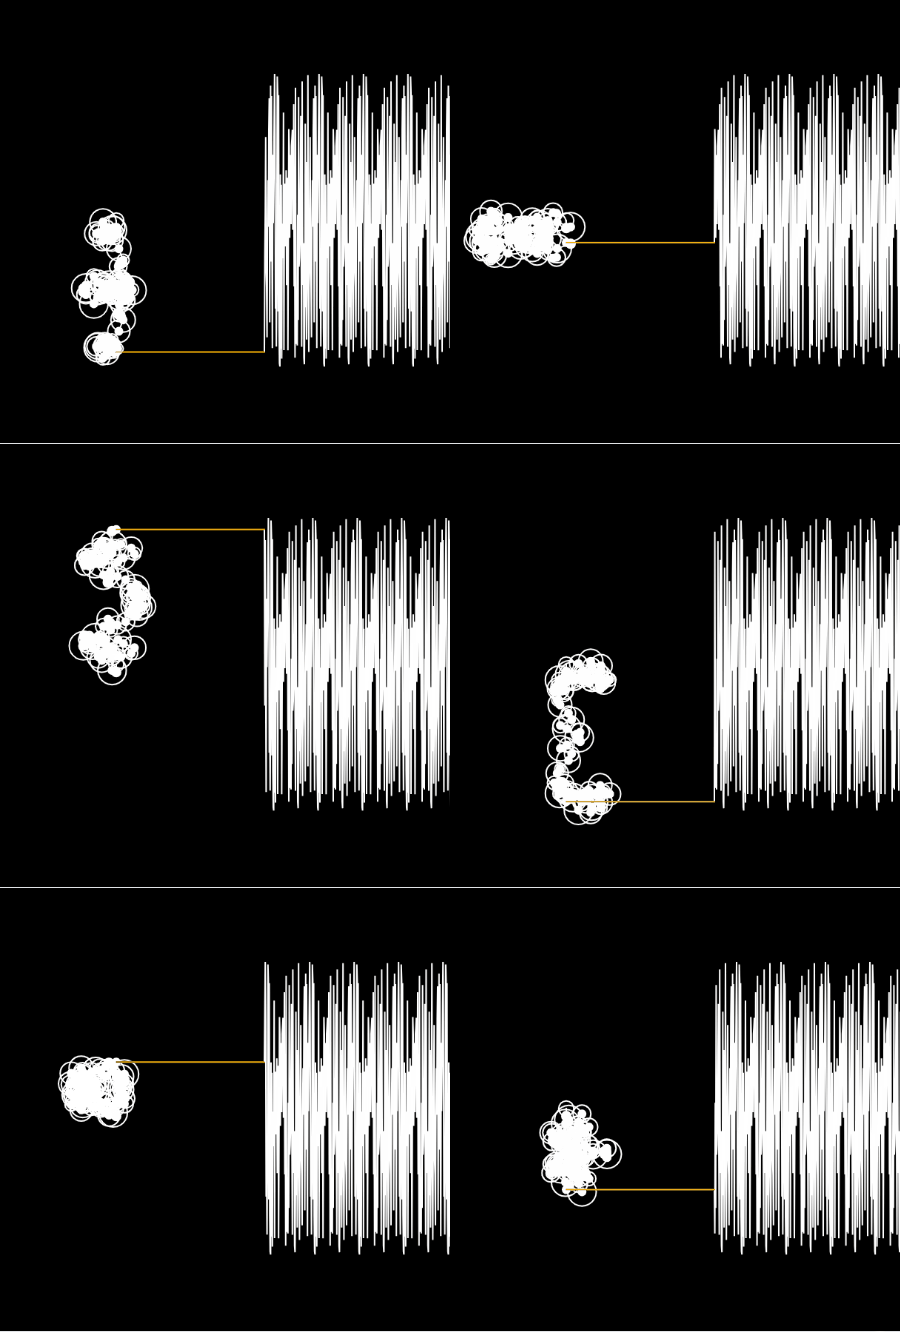
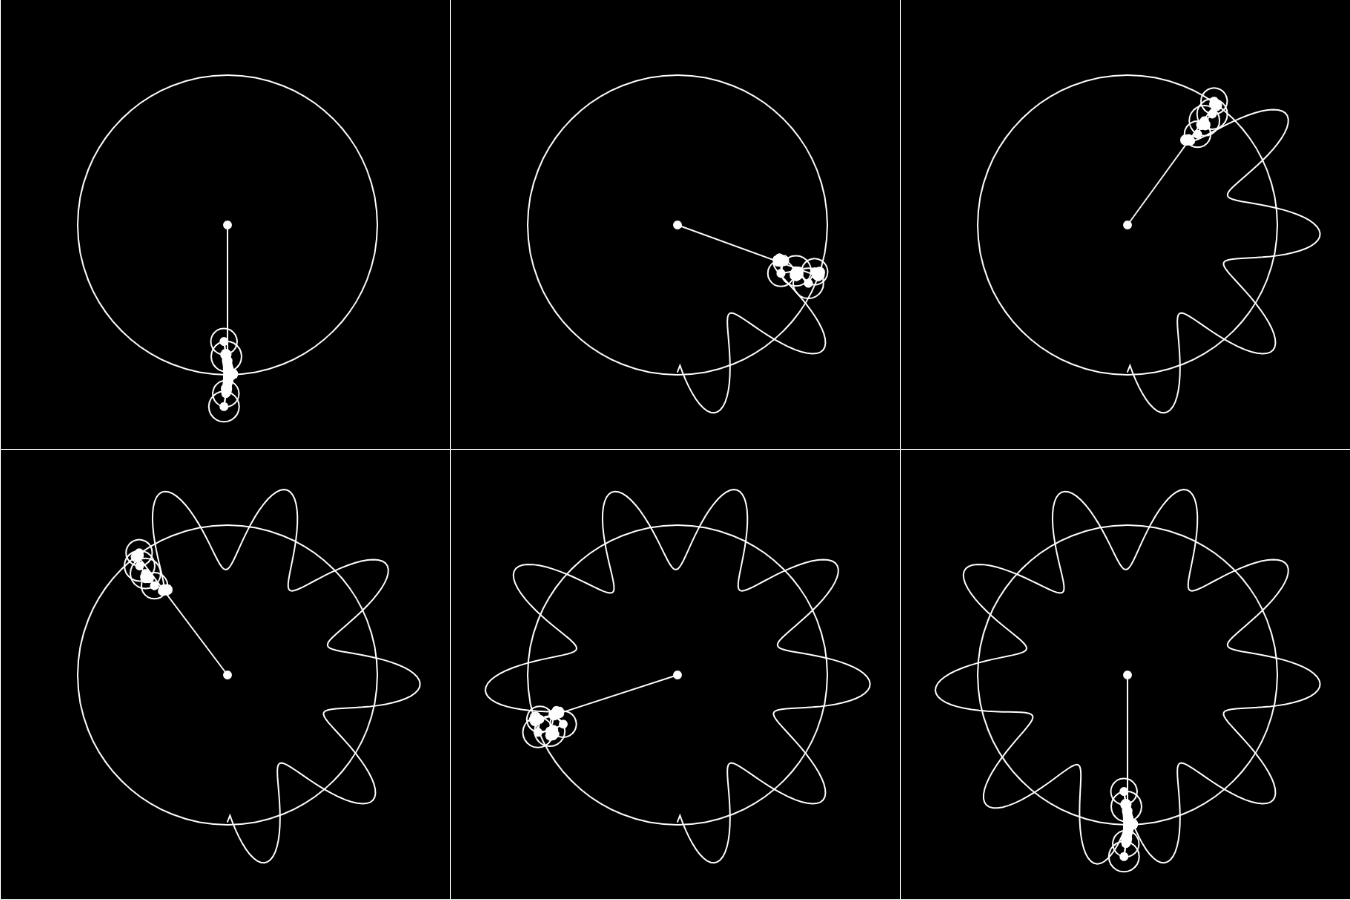
Fourier series use rotating circles, often called epicycles, to create different waves. Adding more circles allows the system to represent more complex changes.
Testing Fourier Transform in p5.js
From Circles to Values
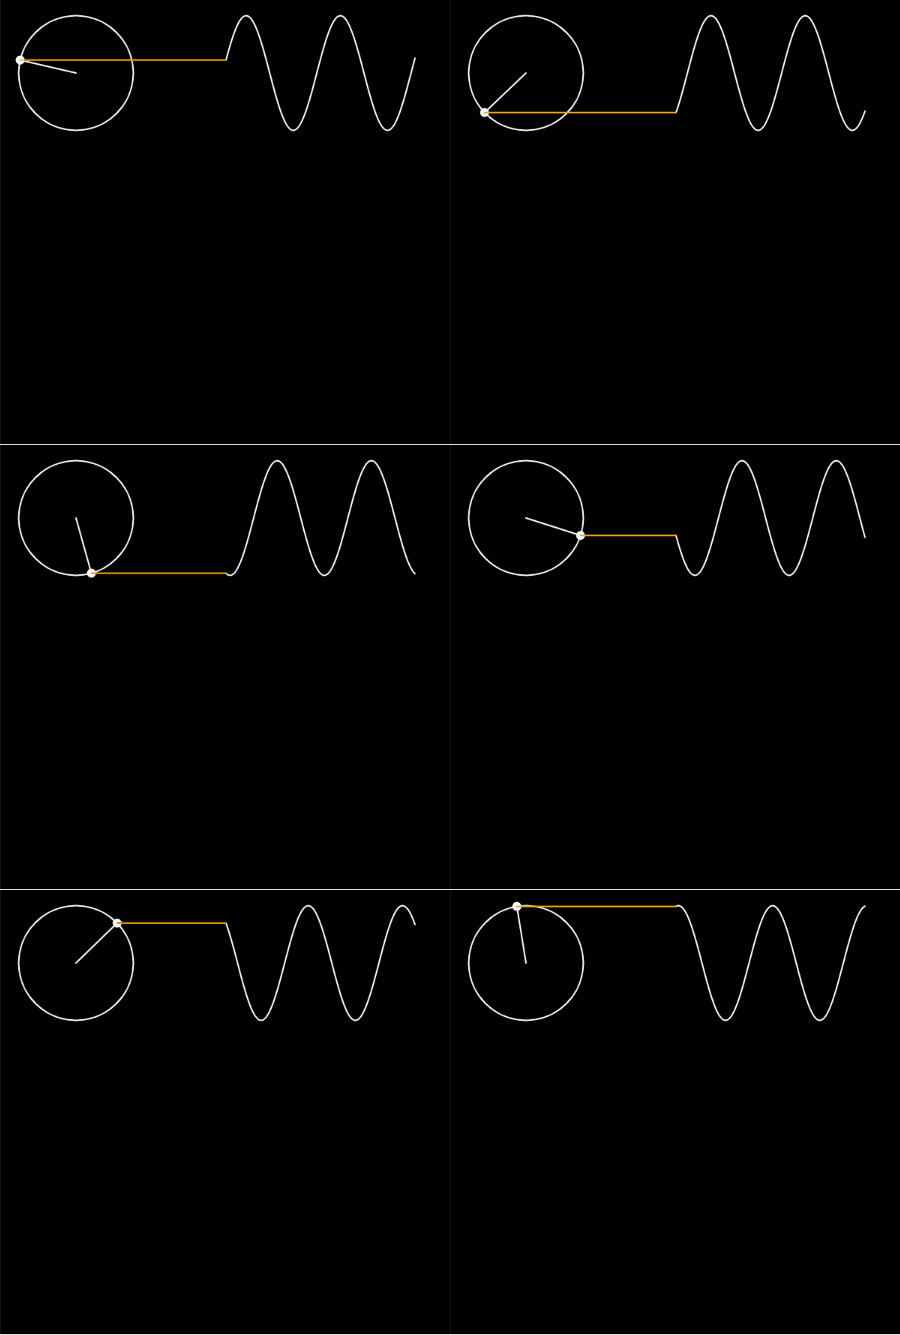
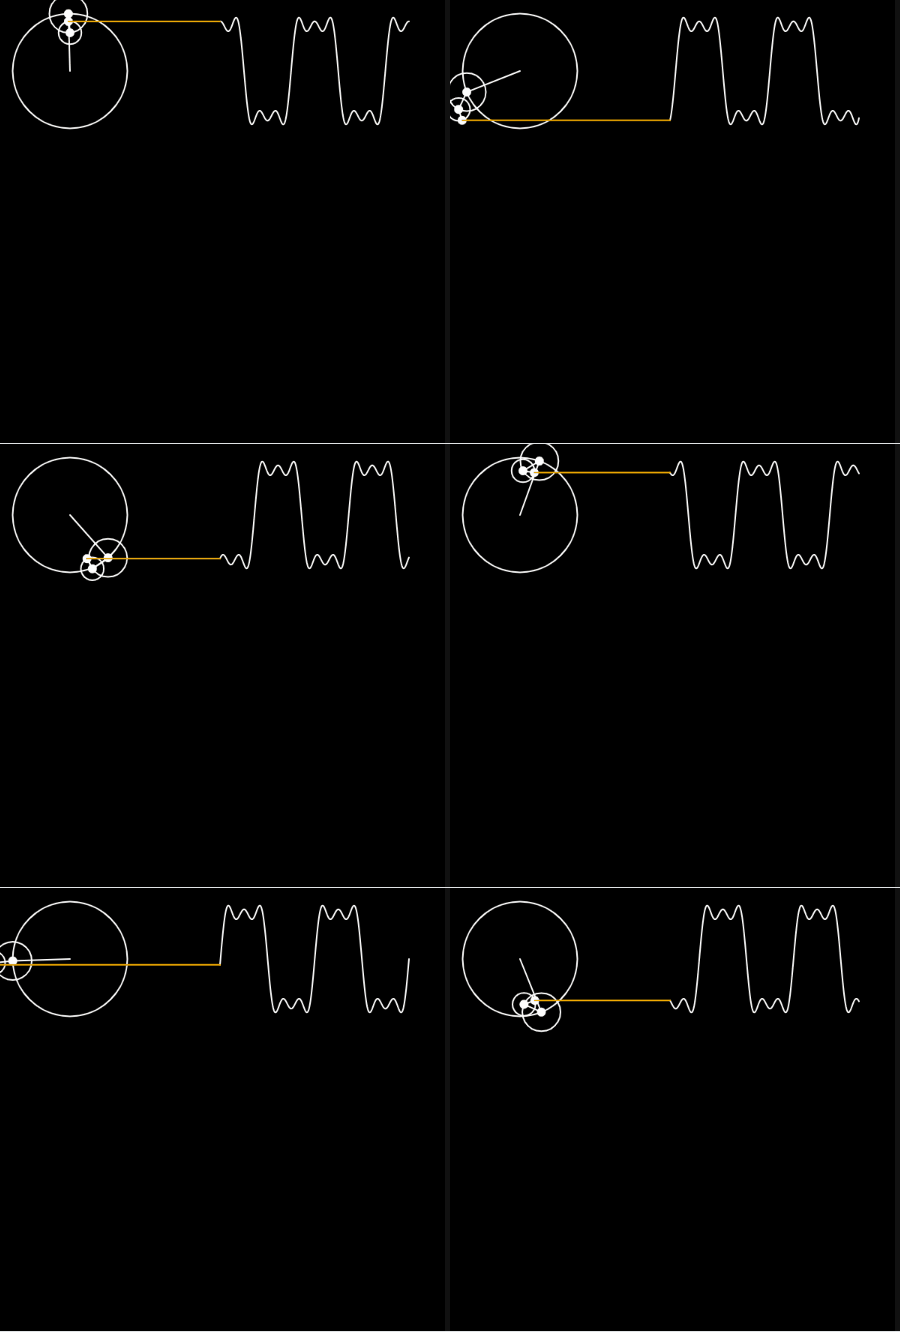
I first followed a p5.js Fourier series example to understand how several rotating circles generate a sequence of values.
From Values to Circles
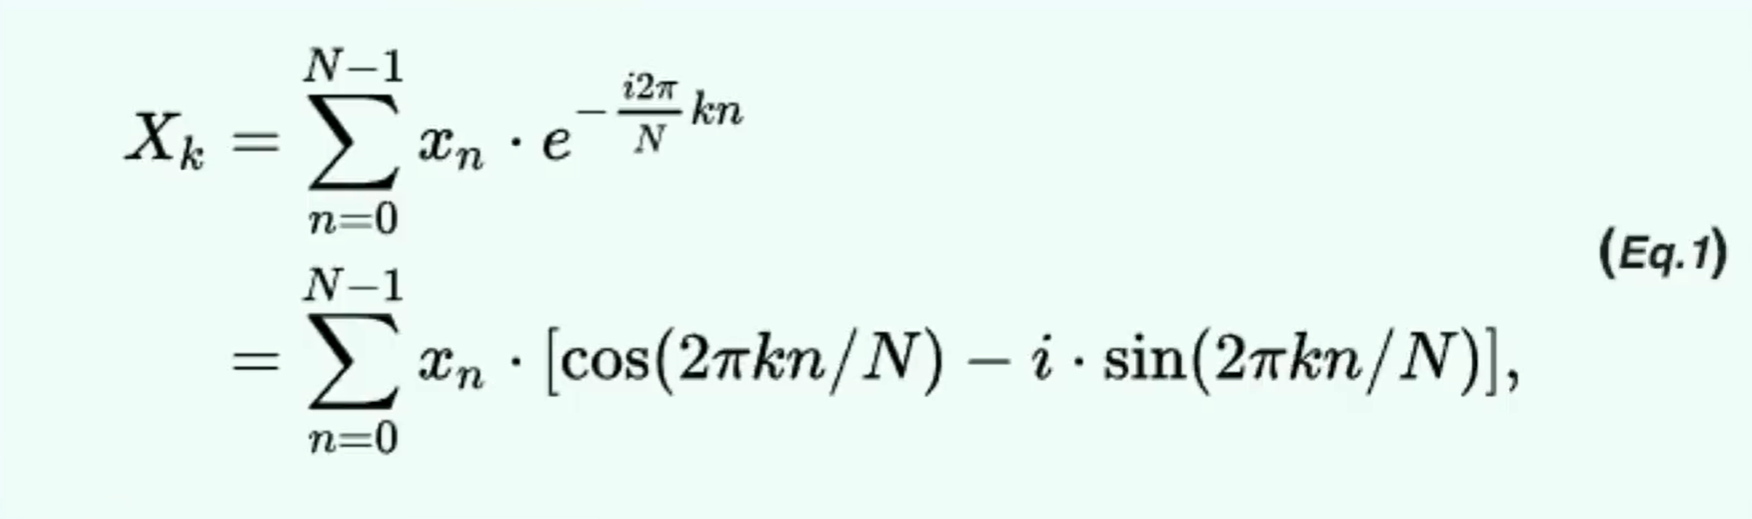
Next, I implemented a discrete Fourier transform. It converts a sequence of values into frequency, amplitude, and phase values that can be drawn as rotating circles.
Discrete Fourier transform code
function dft(values) {
  const result = [];
  const count = values.length;

  for (let k = 0; k < count; k++) {
    let real = 0;
    let imaginary = 0;

    for (let n = 0; n < count; n++) {
      const angle = (TWO_PI * k * n) / count;
      real += values[n] * cos(angle);
      imaginary -= values[n] * sin(angle);
    }

    real /= count;
    imaginary /= count;

    result[k] = {
      re: real,
      im: imaginary,
      freq: k,
      amp: sqrt(real * real + imaginary * imaginary),
      phase: atan2(imaginary, real)
    };
  }

  return result;
}
Moving from One Dimension to Two
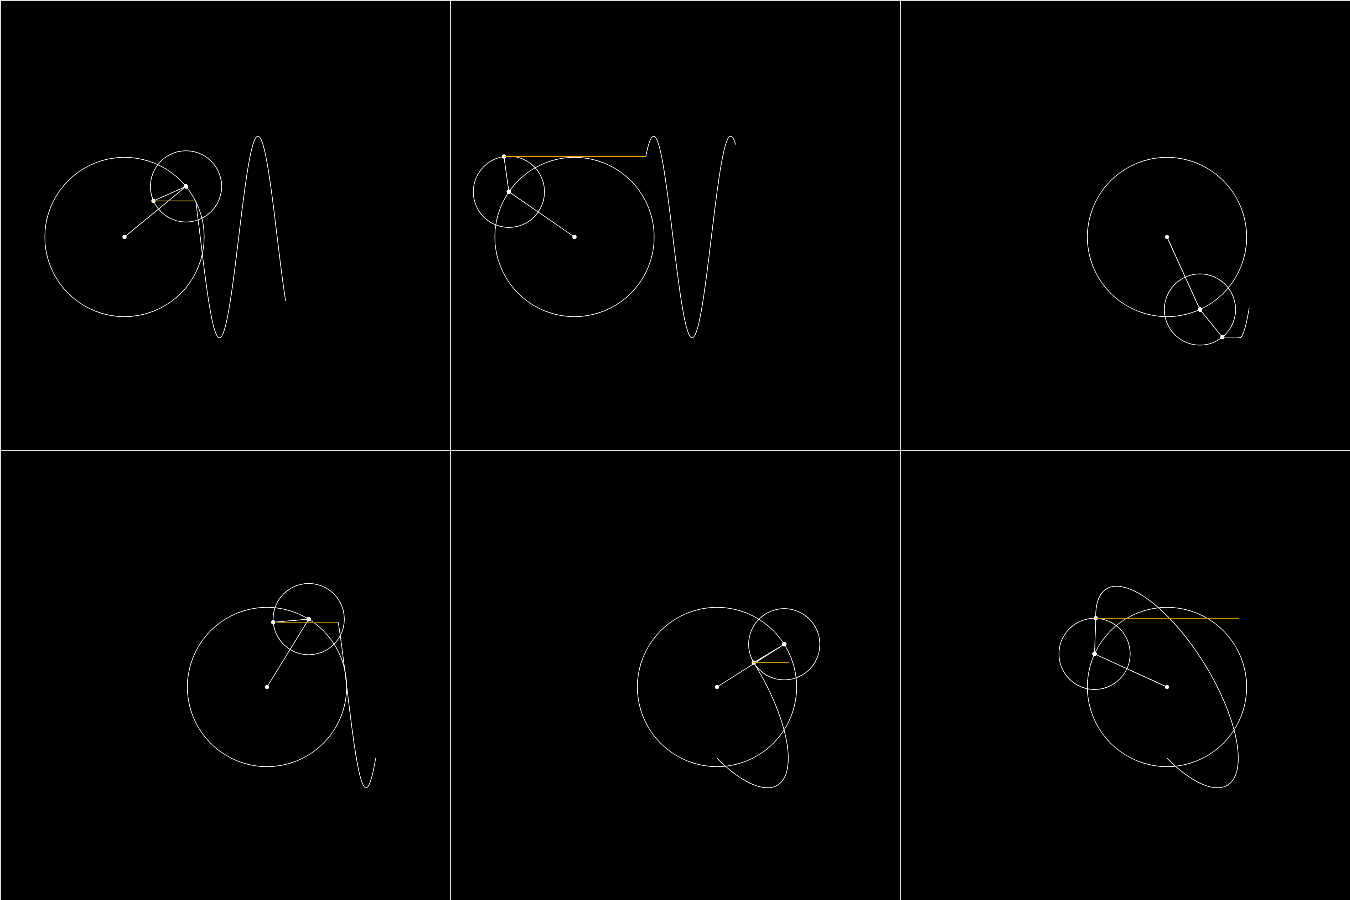
To draw a portrait, I extended the transform from a list of vertical values to a list of two-dimensional {x, y} points.
const radius = 100;
const step = TWO_PI / 360;

for (let i = 0; i < 360; i++) {
  const offset = 30 * sin(i / 6);
  const x = (radius + offset) * cos(step * i);
  const y = (radius + offset) * sin(step * i);
  points.push({ x, y });
}

fourierXY = dft2D(points);
Two-dimensional DFT code
function dft2D(points) {
  const result = [];
  const count = points.length;

  for (let k = 0; k < count; k++) {
    let real = 0;
    let imaginary = 0;

    for (let n = 0; n < count; n++) {
      const angle = (TWO_PI * k * n) / count;
      real += points[n].x * cos(angle) + points[n].y * sin(angle);
      imaginary += points[n].y * cos(angle) - points[n].x * sin(angle);
    }

    real /= count;
    imaginary /= count;
    result[k] = {
      re: real,
      im: imaginary,
      freq: k,
      amp: sqrt(real * real + imaginary * imaginary),
      phase: atan2(imaginary, real)
    };
  }

  return result;
}
Preparing the Mona Lisa
First Attempt: Thresholded SVG
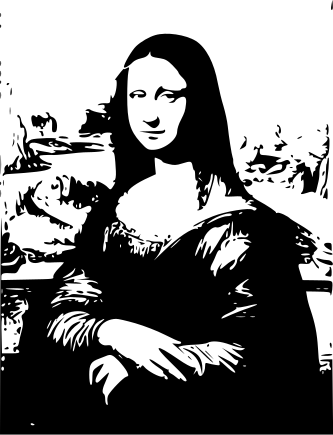
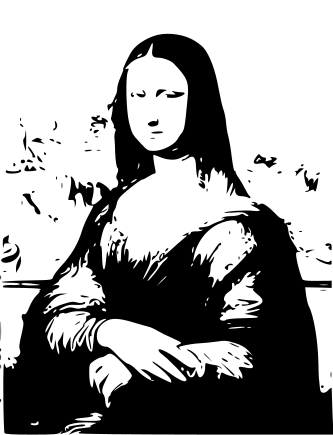
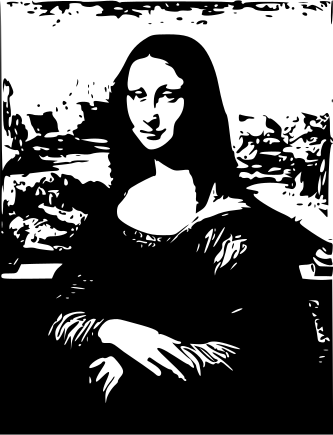
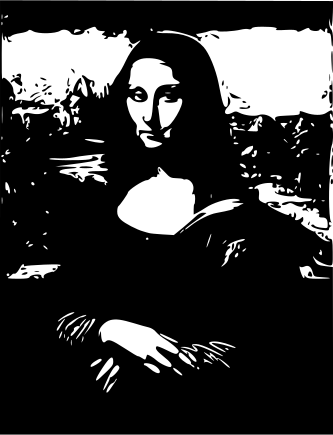
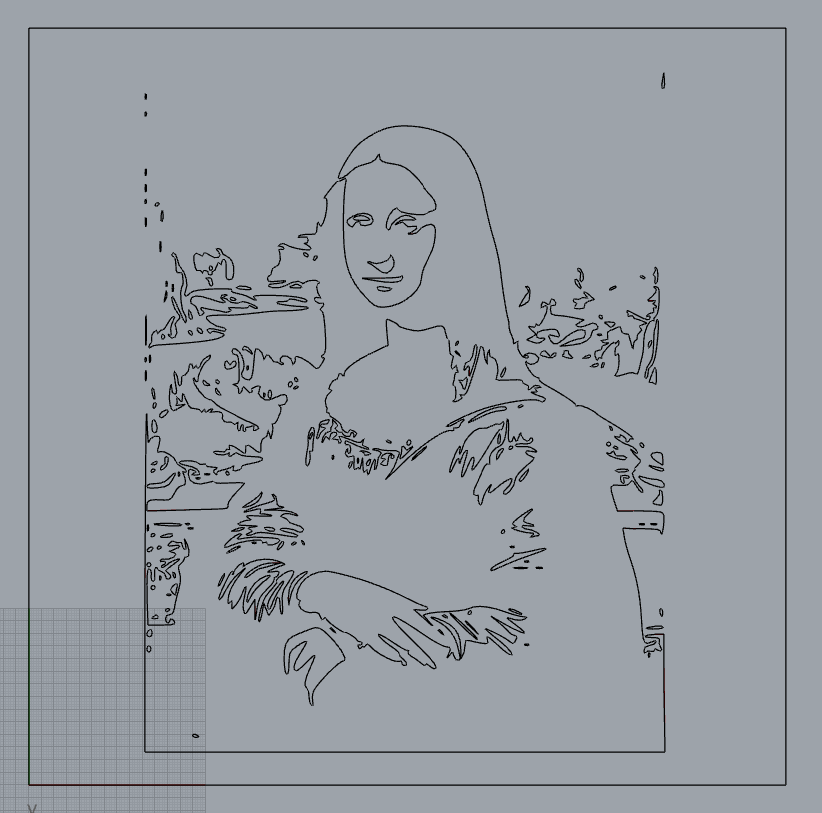
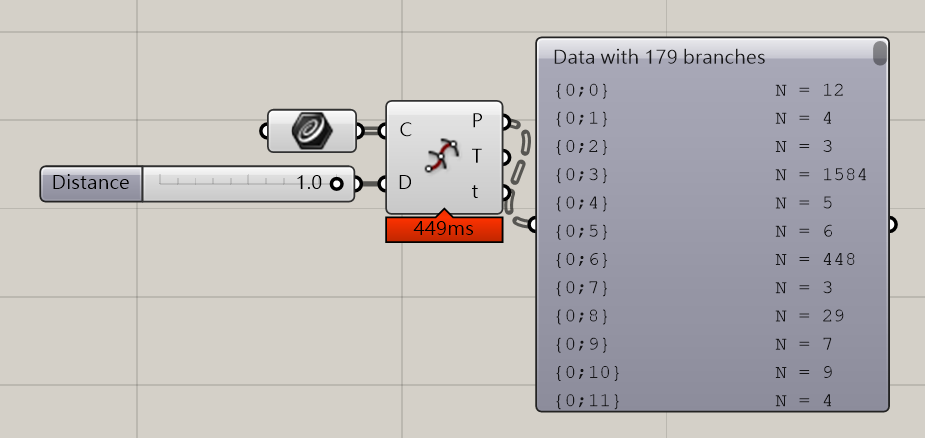
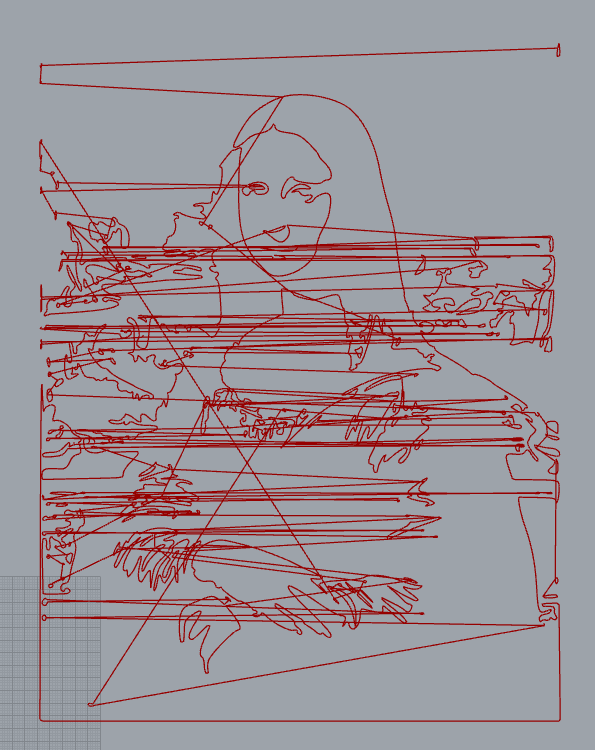
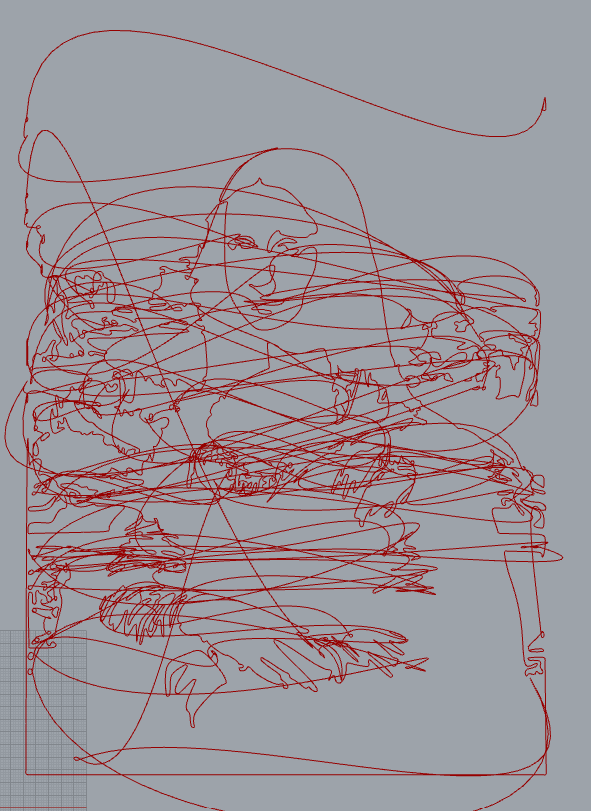
My first approach converted the source image into a black-and-white SVG with ImageMagick and Potrace. I tested several grayscale thresholds, sorted the resulting points in Grasshopper, and exported them as JSON. The automatic paths did not provide the continuous drawing order I needed, so I changed to a manually drawn line.
Threshold and point-sorting tests
magick monalisa.jpg -colorspace Gray -threshold 50% monalisa.pnm
potrace monalisa.pnm -s -o monalisa.svg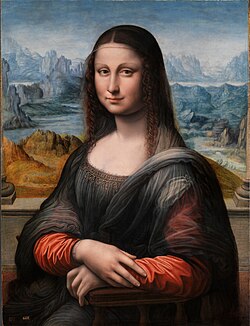
Drawing a Continuous Line
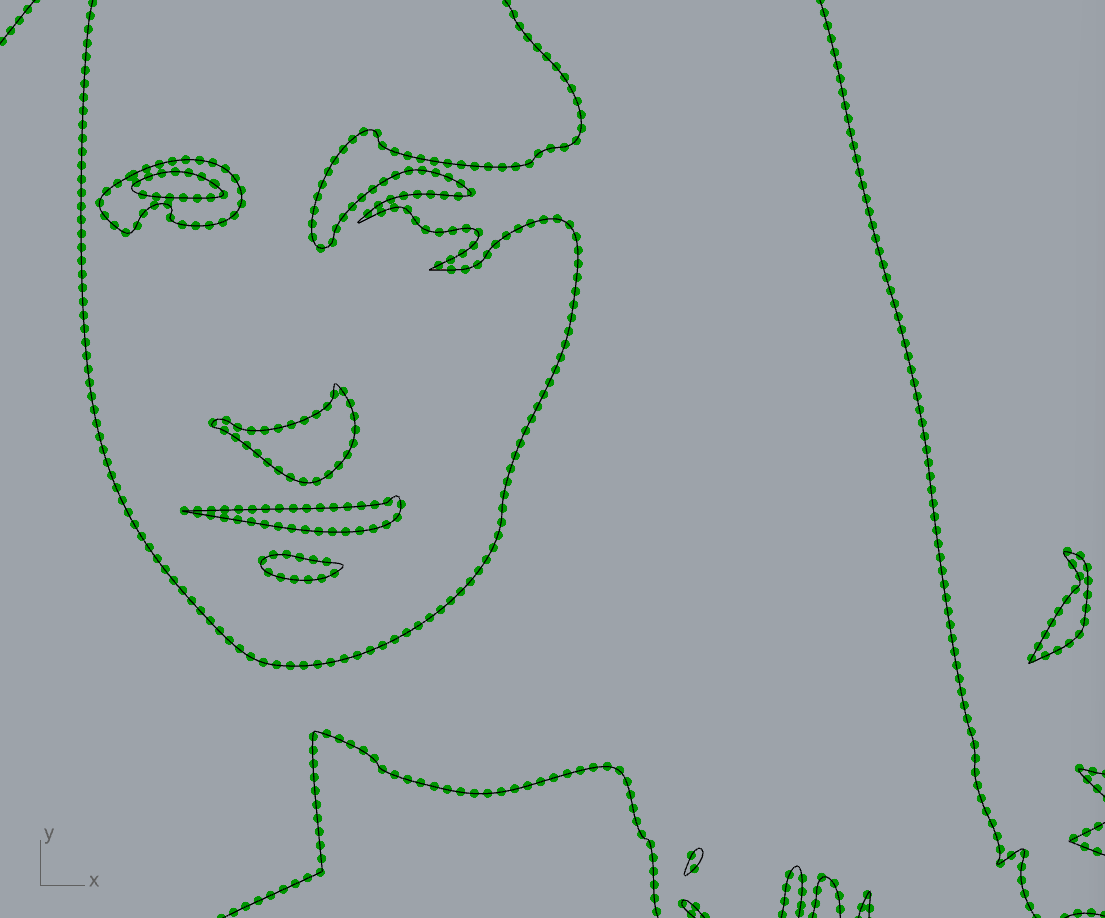
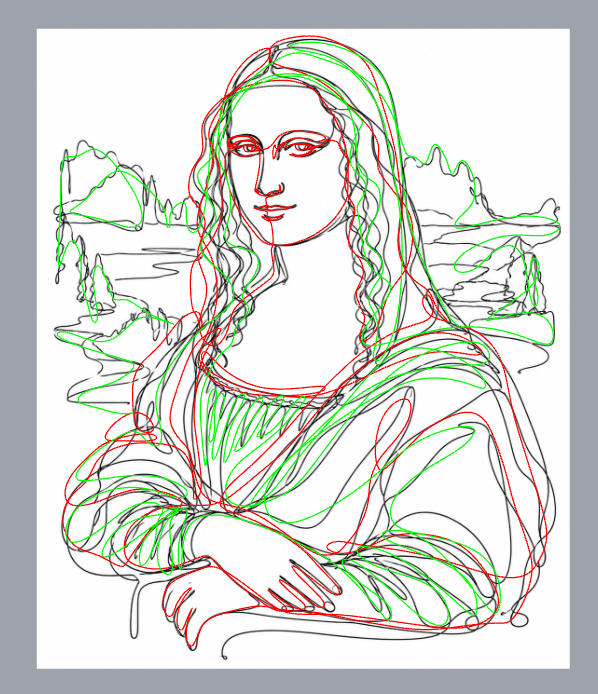
I manually traced the image as a continuous line, then used Grasshopper to divide the curve and export its points as JSON.
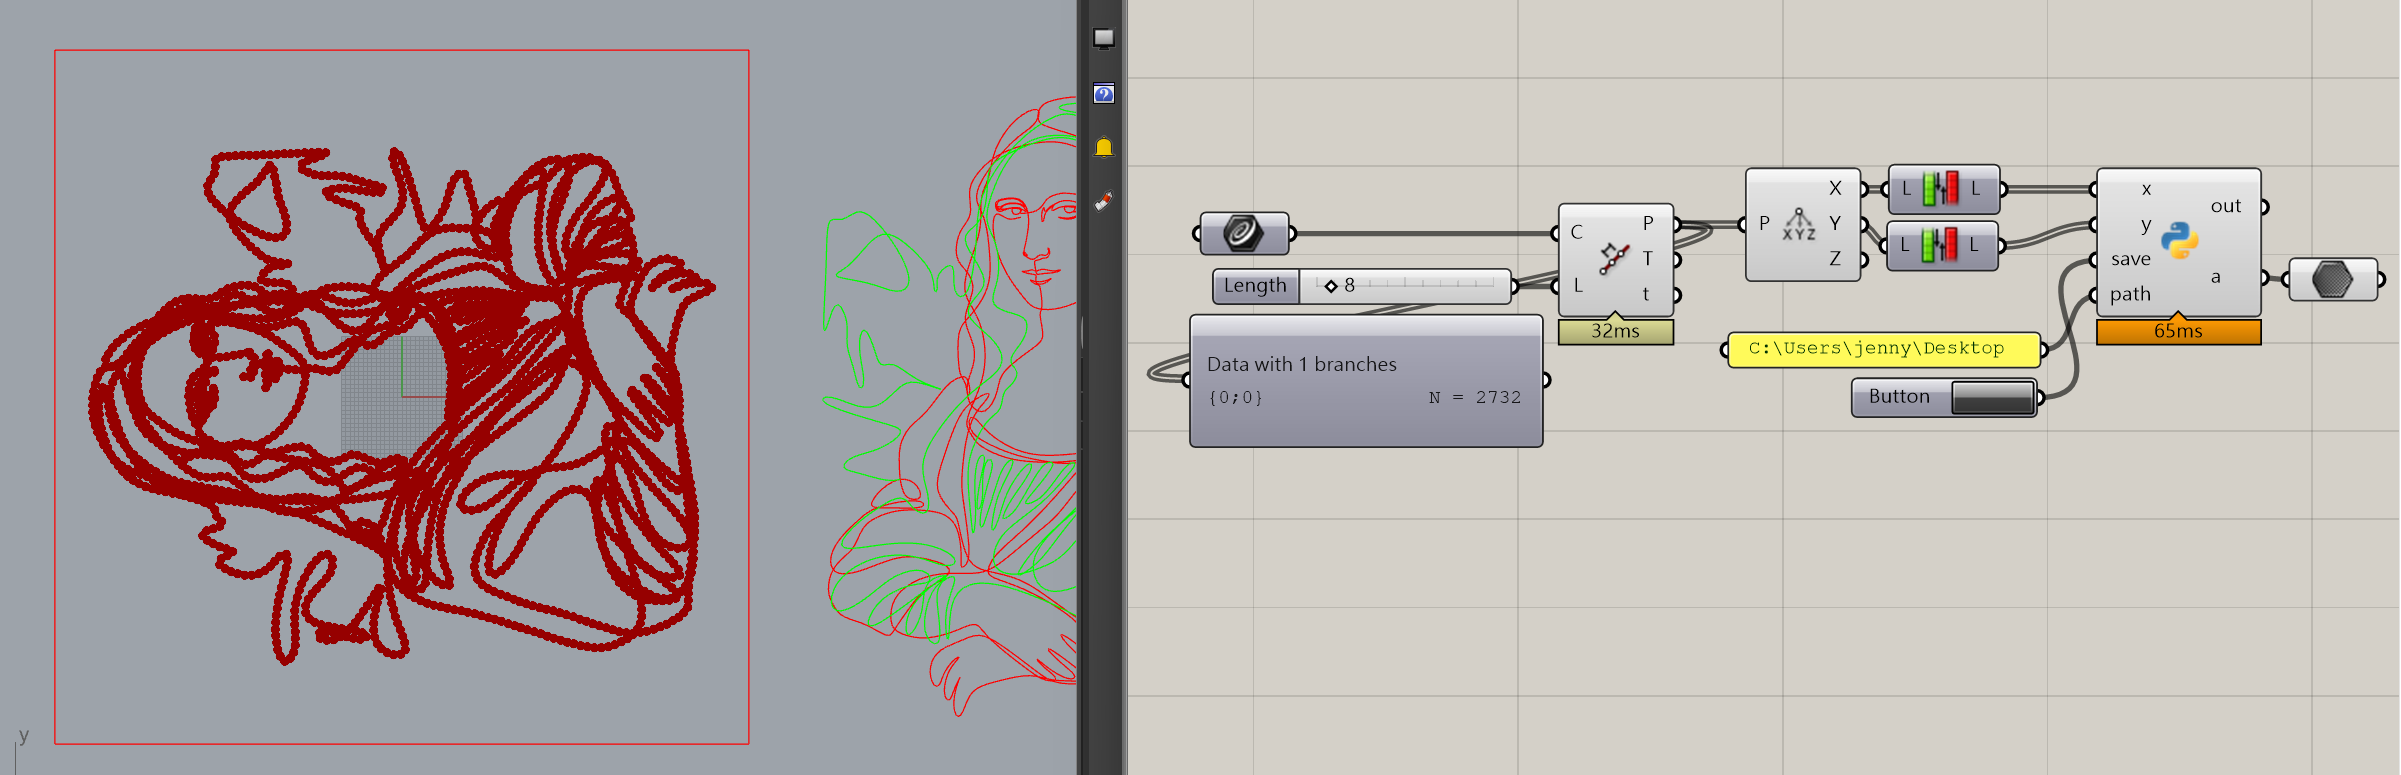
Grasshopper Python export code
import json
import os

results = []

for i in range(x.BranchCount):
    path_id = x.Paths[i]
    branch_x = x.Branch(path_id)
    branch_y = y.Branch(path_id)

    for j in range(len(branch_x)):
        results.append({
            "x": round(float(branch_x[j]), 2),
            "y": round(float(branch_y[j]), 2)
        })

output = json.dumps(results, indent=2)

if save and path:
    file_path = os.path.join(path, "monalisa.json")
    with open(file_path, "w") as file:
        file.write(output)
[
{ "x": 83.77, "y": 194.93 },
{ "x": 84.81, "y": 202.84 },
{ "x": 84.15, "y": 210.8 }
]Fourier Mona Lisa
The exported points are transformed into frequency components. During drawing, the system adds the circles one by one and stores the current endpoint to build the portrait path.
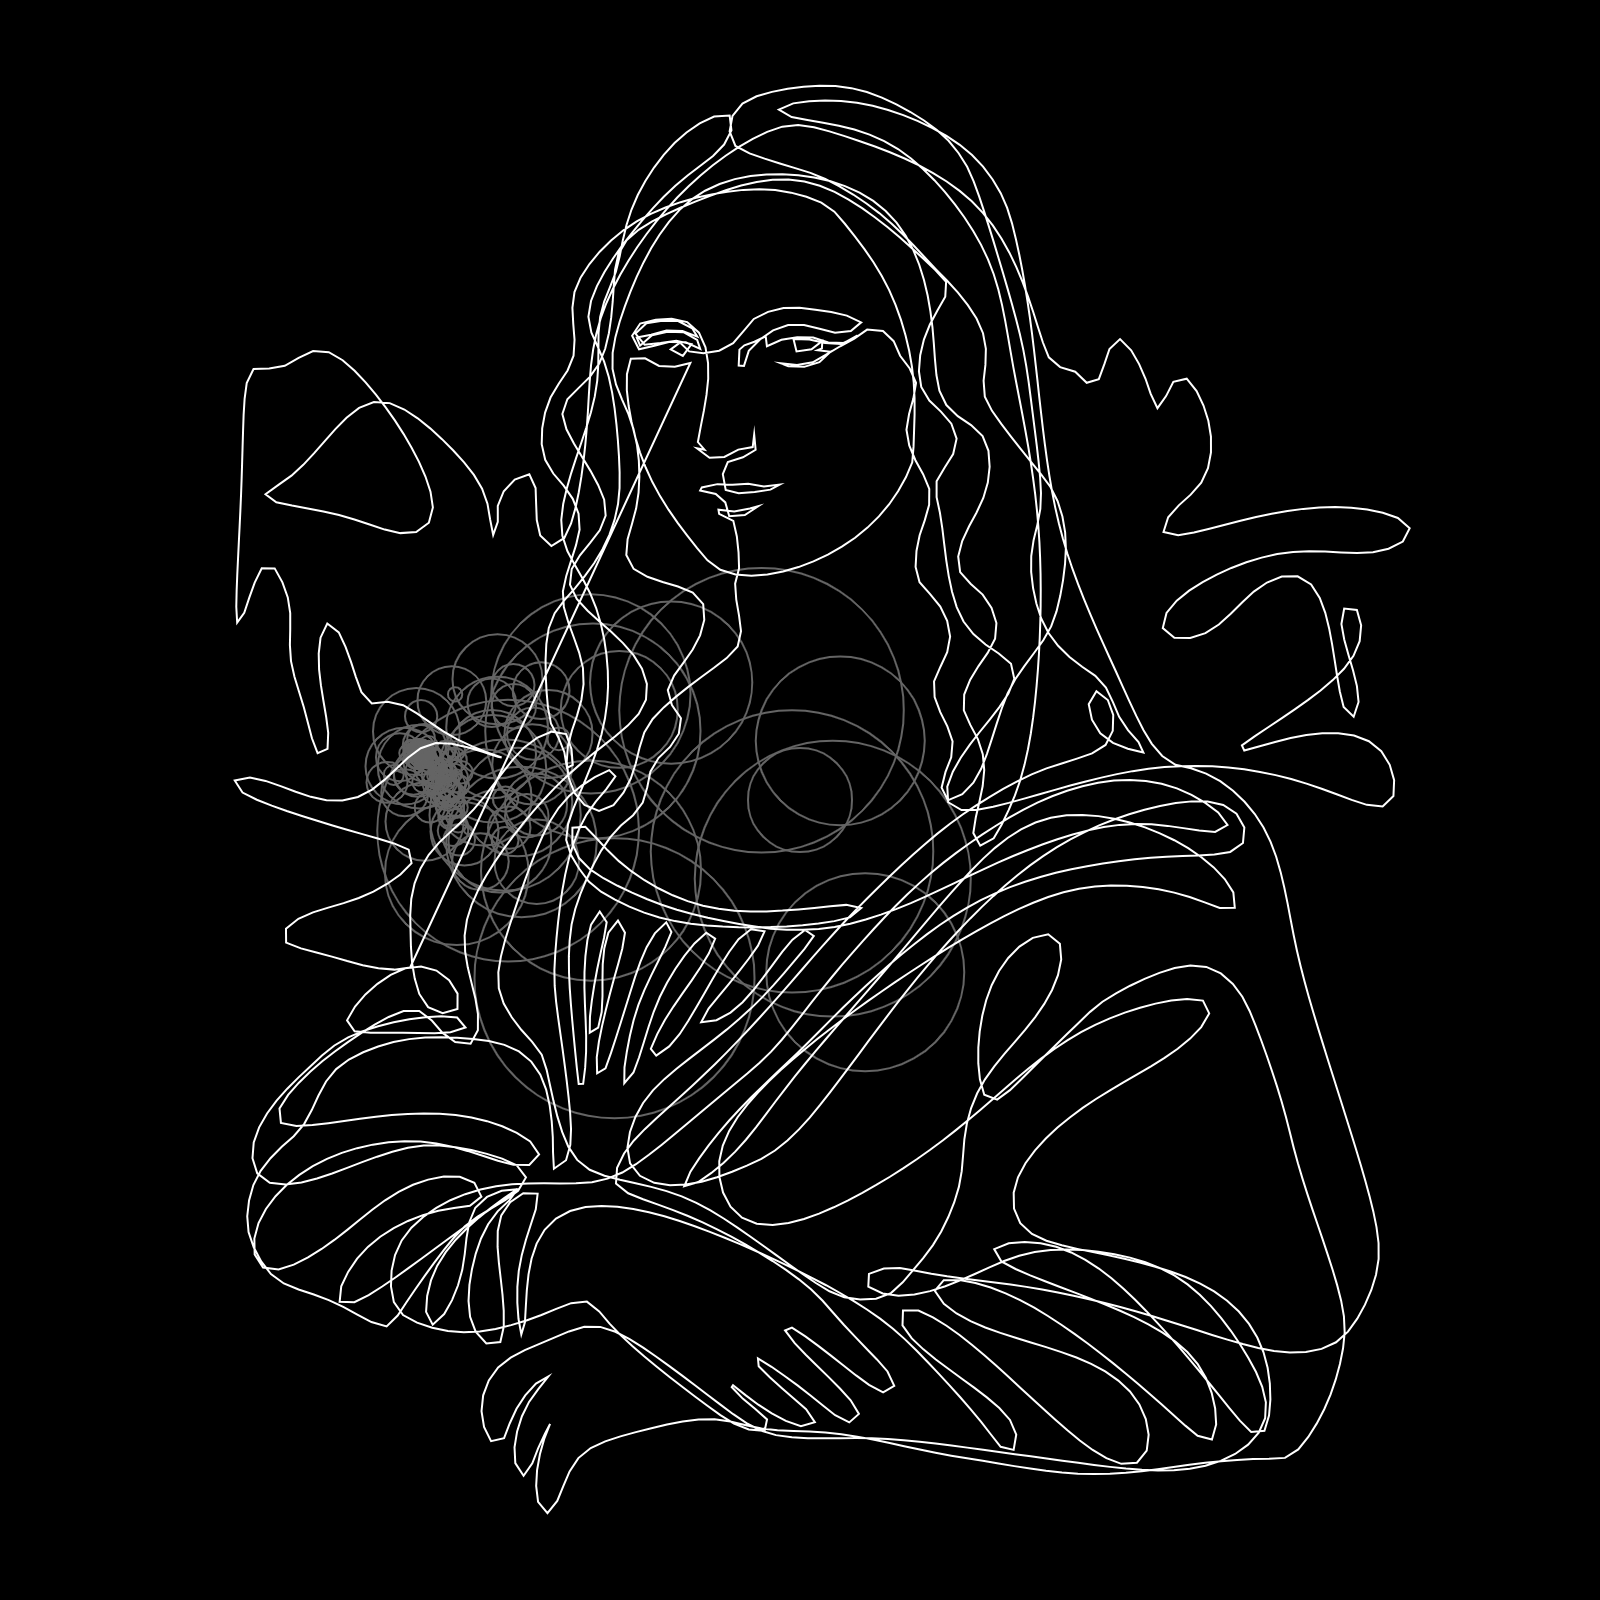
Fourier Mona Lisa drawing code
async function setup() {
  createCanvas(800, 800);
  const data = await loadJSON('monalisa.json');

  for (const value of Object.values(data)) {
    points.push(value);
  }

  fourierXY = dft2D(points);
}

function draw() {
  background(0);
  translate(width / 2, height / 2);

  let x = 0;
  let y = 0;

  for (const component of fourierXY) {
    x += component.amp * cos(component.freq * time + component.phase + HALF_PI);
    y += component.amp * sin(component.freq * time + component.phase + HALF_PI);
  }

  wave.unshift({ x, y });
  beginShape();
  wave.forEach((point) => vertex(point.x, point.y));
  endShape();

  time -= TWO_PI / fourierXY.length;
}
Reducing the Number of Circles
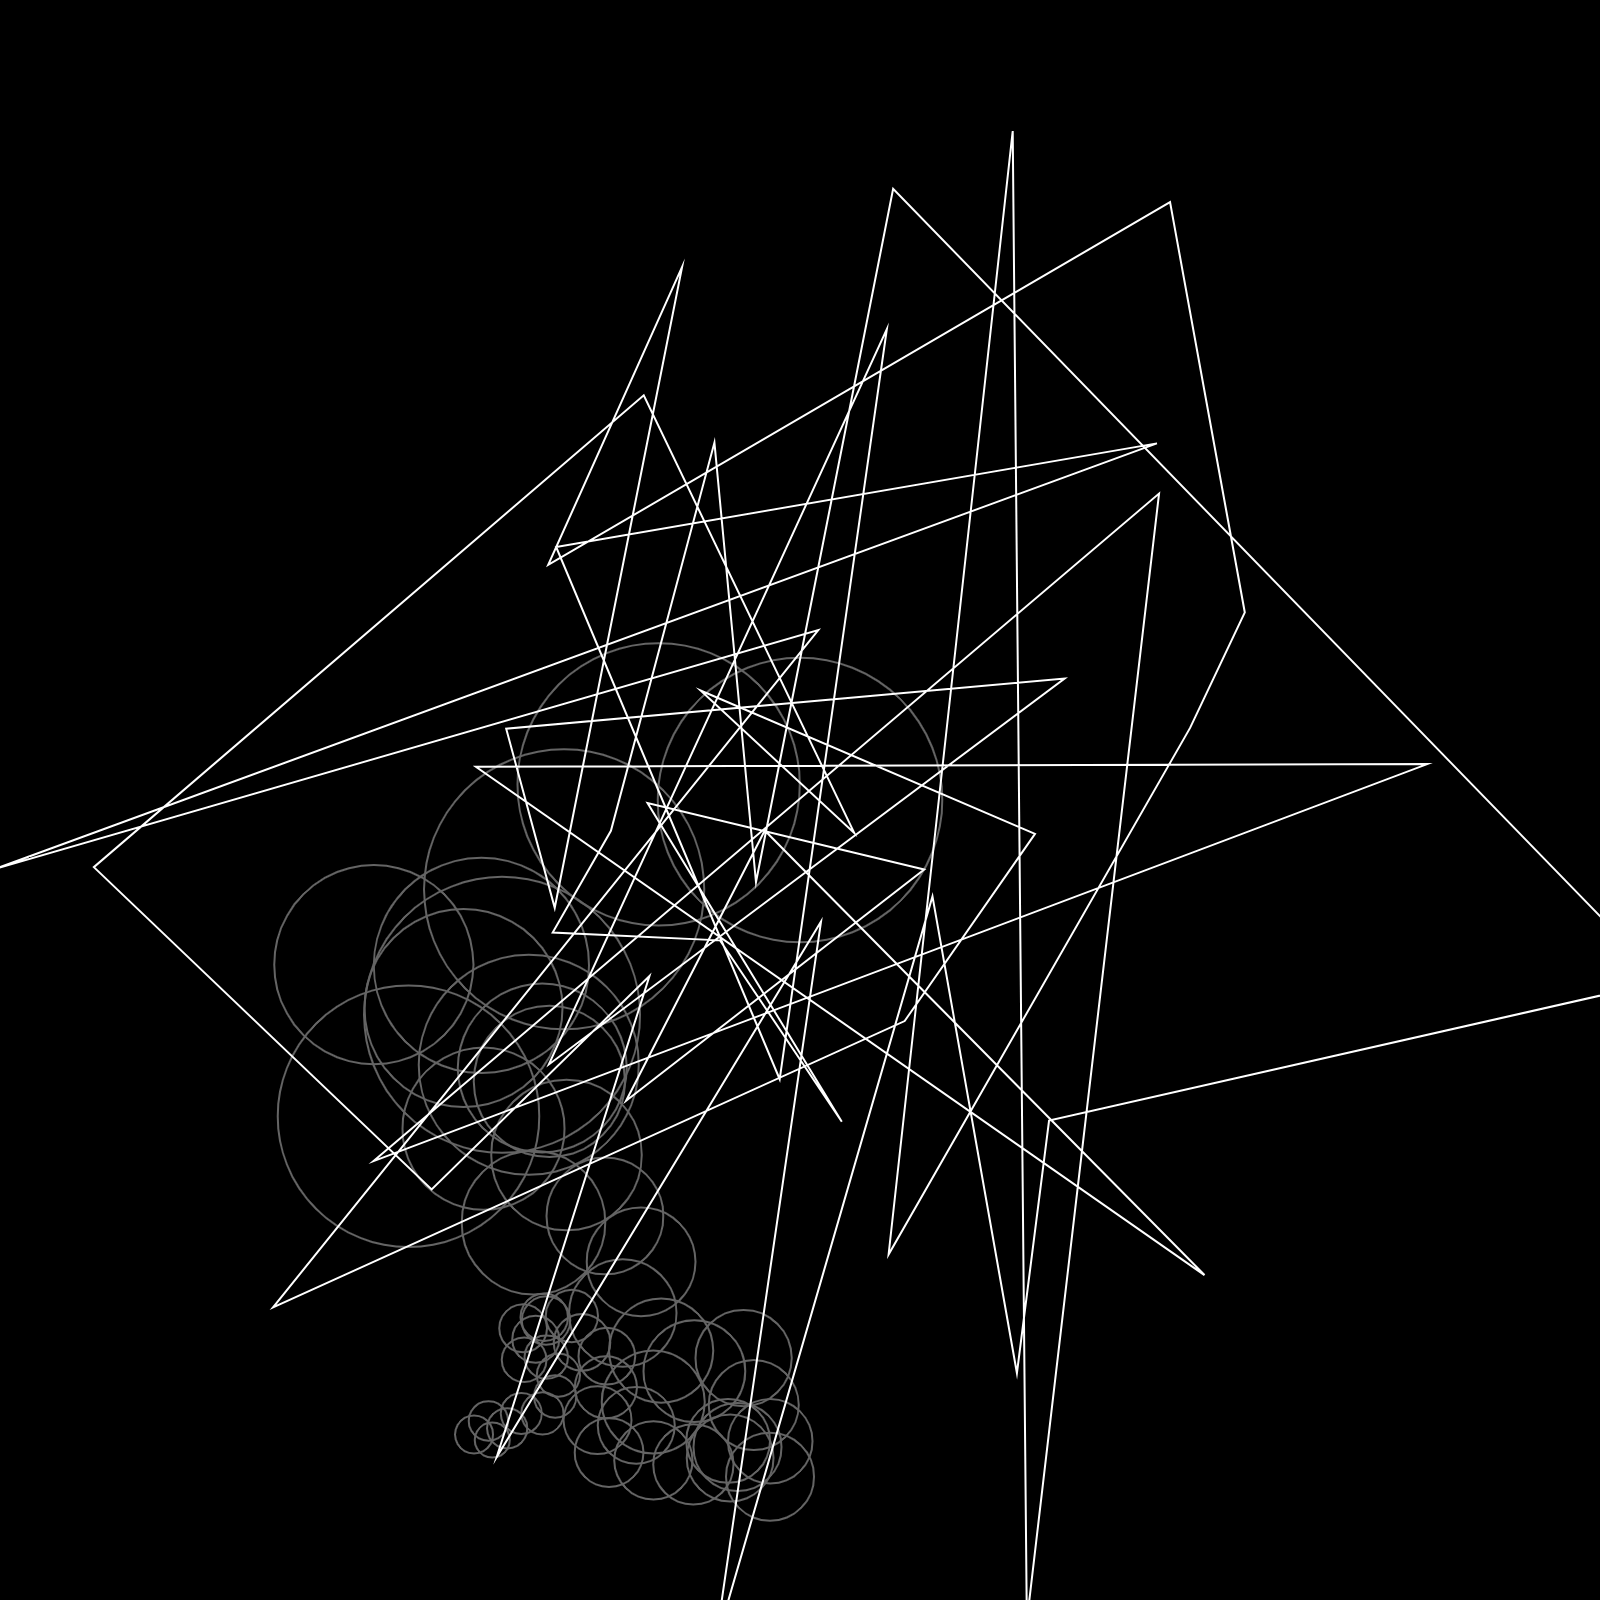
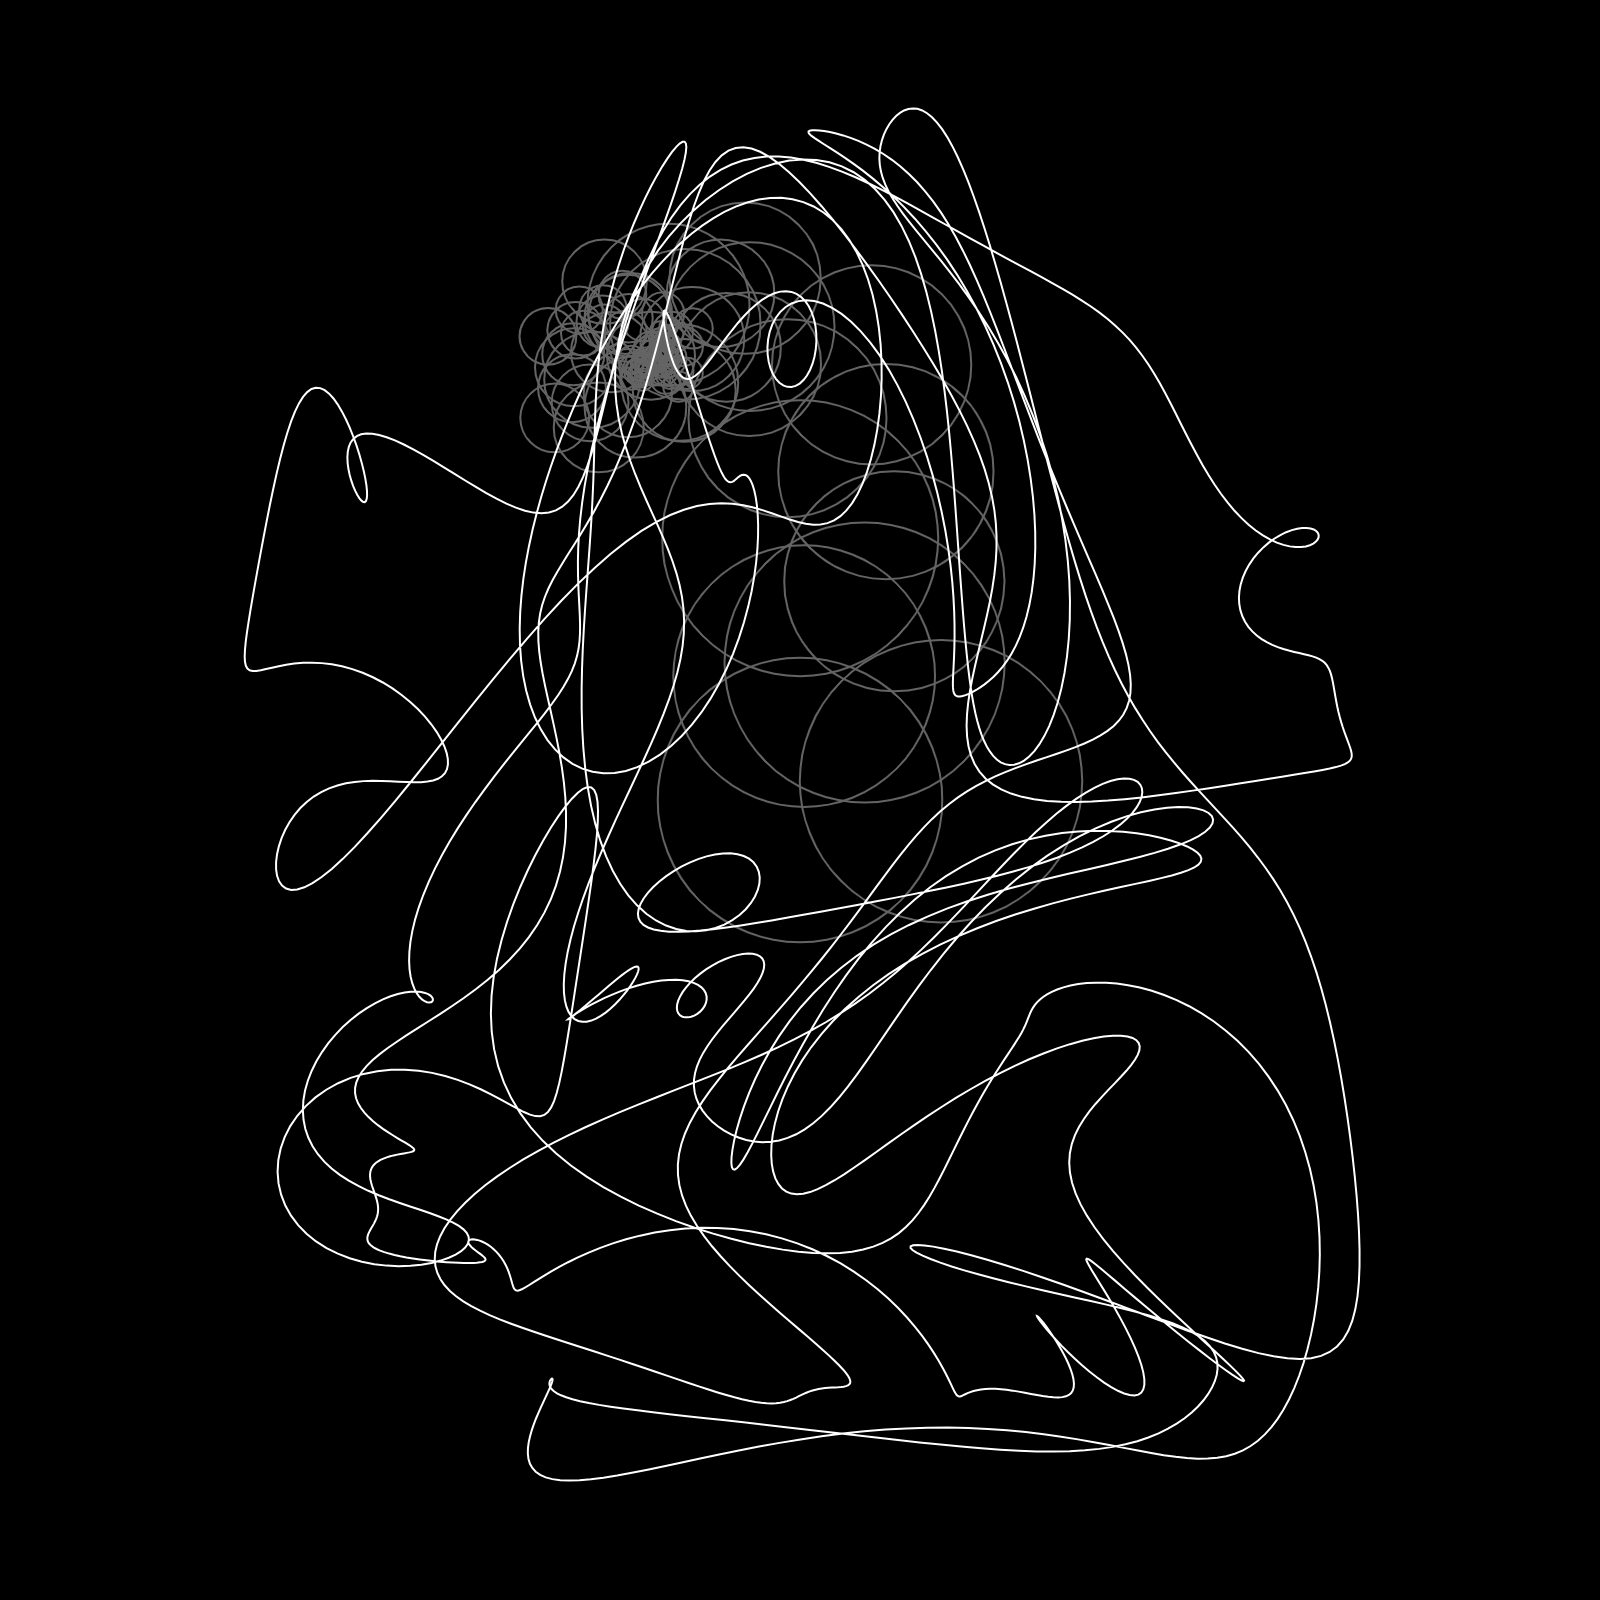
The number of circles can change without changing the total drawing time. To keep the duration fixed, the time step uses the length of the complete Fourier dataset rather than the reduced list.
const dt = TWO_PI / allFourier.length;
time -= dt;
Testing the Number of Circles
More circles provide more frequency information and produce a more detailed drawing.
Sampling Colors from the Image
The final background samples colors from the source image. Large translucent shapes appear first, followed by smaller shapes that gradually add local detail while the white Fourier line completes the portrait.